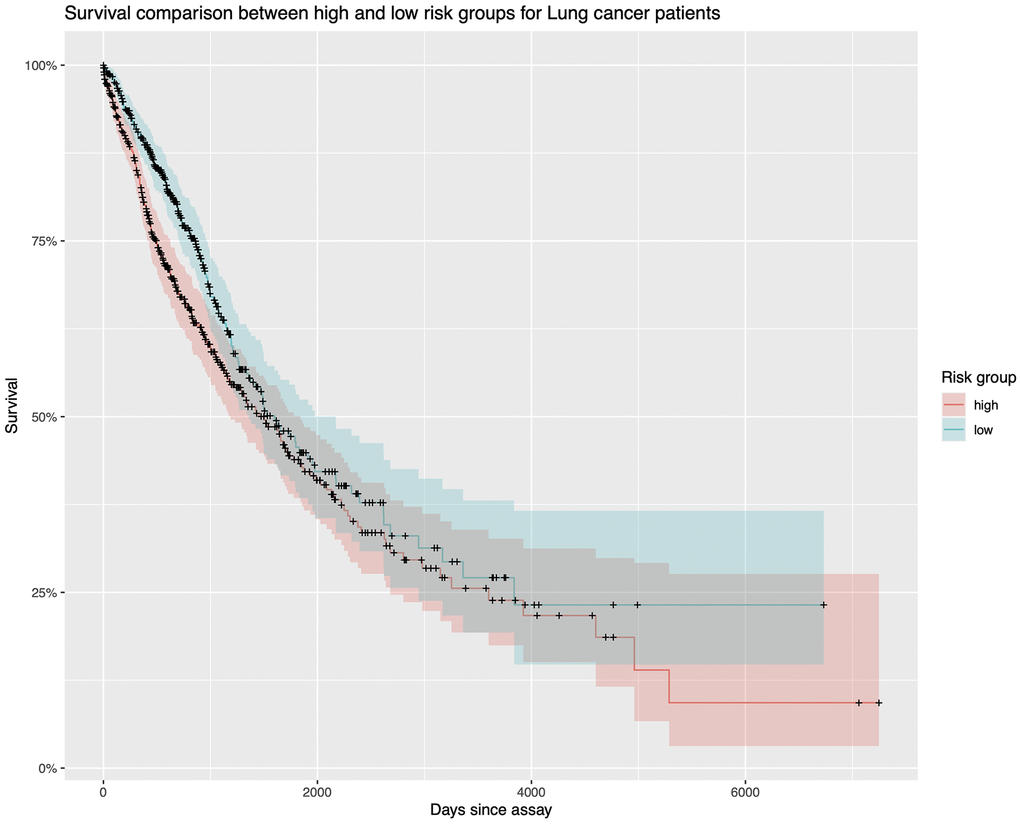
Figure 7.Survival analysis. The Kaplan Meier plot for TCGA lung cancer samples. The red line represents those samples with higher lncRNA expression values. The green line represents those samples with lower lncRNA expression levels. Because they intersect several times, the diagnostic ability is not good enough.