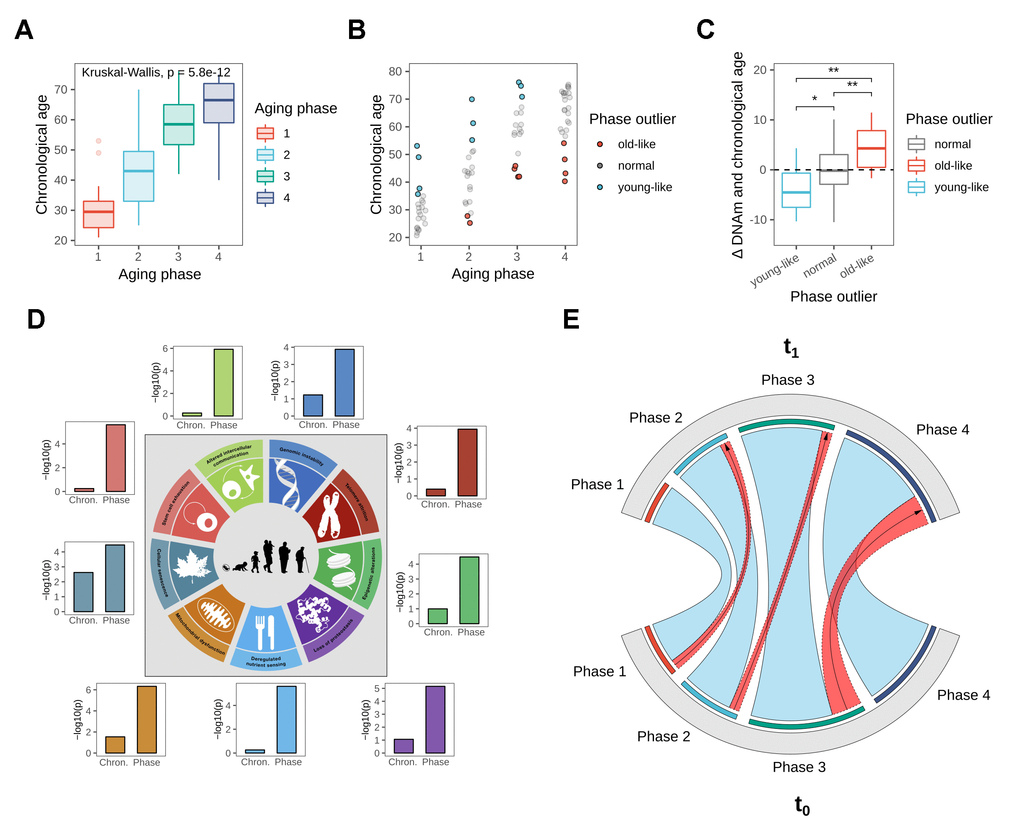
Figure 3.Biological age validation of the identified phases. (A) Boxplot showing chronological age distributions among the four identified aging phases. (B) Chronological age outliers among the aging phases, denoted as “old-like” for subjects that appeared to prematurely cluster into a higher aging phase, and “young-like” for subjects that were classified into a lower aging phase relative to their chronological age. (C) Boxplot showing the deviation of DNAm from chronological age based on aging phase outlier status, revealing a divergence in DNAm aging rate for aging phase outliers. Statistical significance determined using pairwise T-tests. (D) Hallmark of Aging signal strengths in gene expression data, comparing chronological age groups to the biological aging phases. Shown are the adjusted p-values from Anova comparisons, testing the segregation of the groupings among gene set enrichment scores. Figure adapted from the original Hallmark of Aging publication [15]. (E) Longitudinal validation after three-year period. The chord diagram shows aging phase classification of re-invited subjects at both time points, with phase transitions highlighted in red.
Figure 3 — Multi-omics network analysis reveals distinct stages in the human aging progression in epidermal tissue | Aging