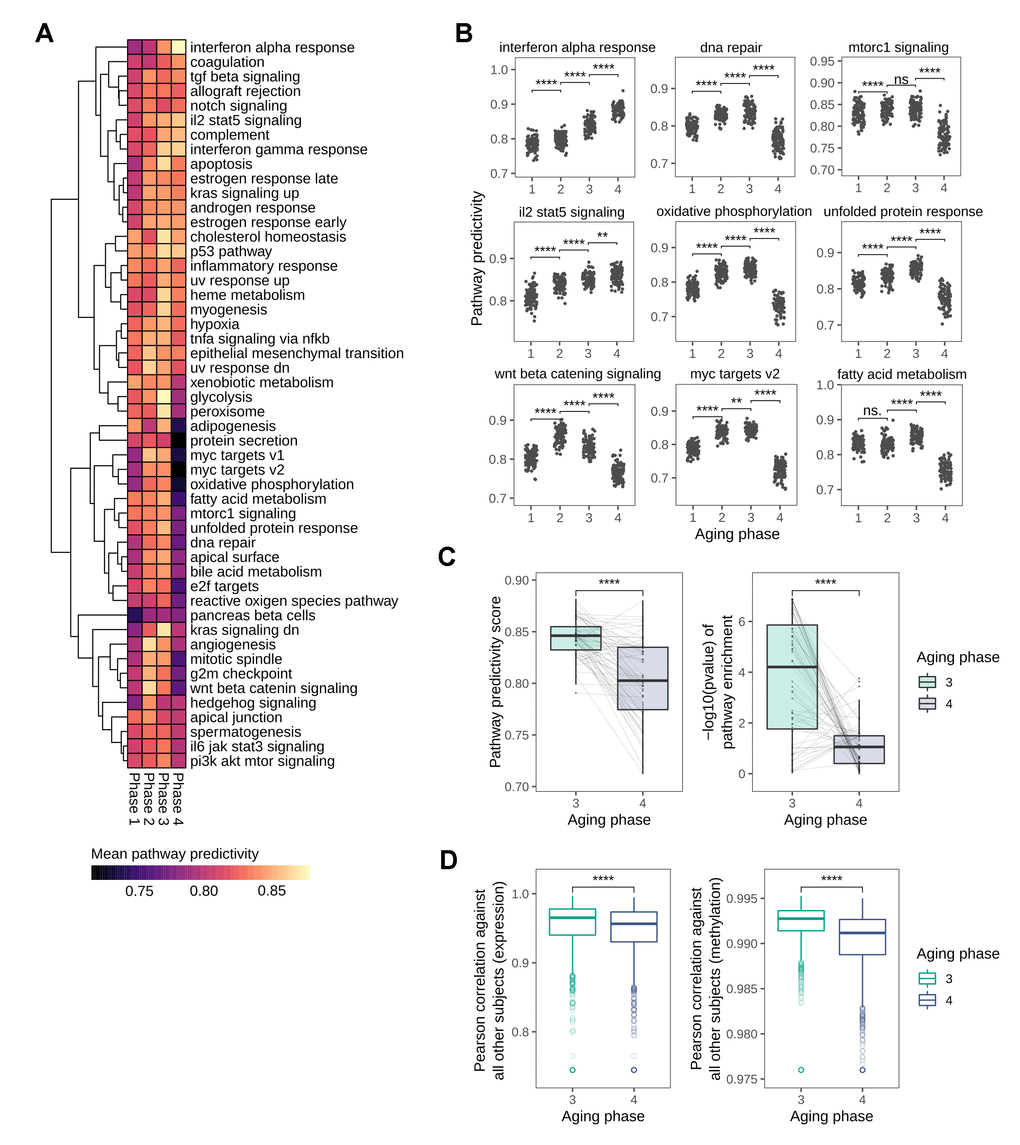
Figure 5.Global loss in pathway predictivity in the transition from mid- to late-life. (A) Heatmap showing the changes in pathway predictivity along the identified aging phases. The predictivities shown are the average predictivities calculated from 100 permutations for every pathway. (B) Scatterplots visualizing the changes in predictivity along the aging phases for selected pathways, several of which show distinctly non-linear patterns. (C) Overall loss in pathway predictivity observed in the transition from aging phase 3 to phase 4 is also detectable using gene set enrichment analysis. (D) Pairwise Pearson correlation between all subjects based on transcriptional and DNA methylation patterns.