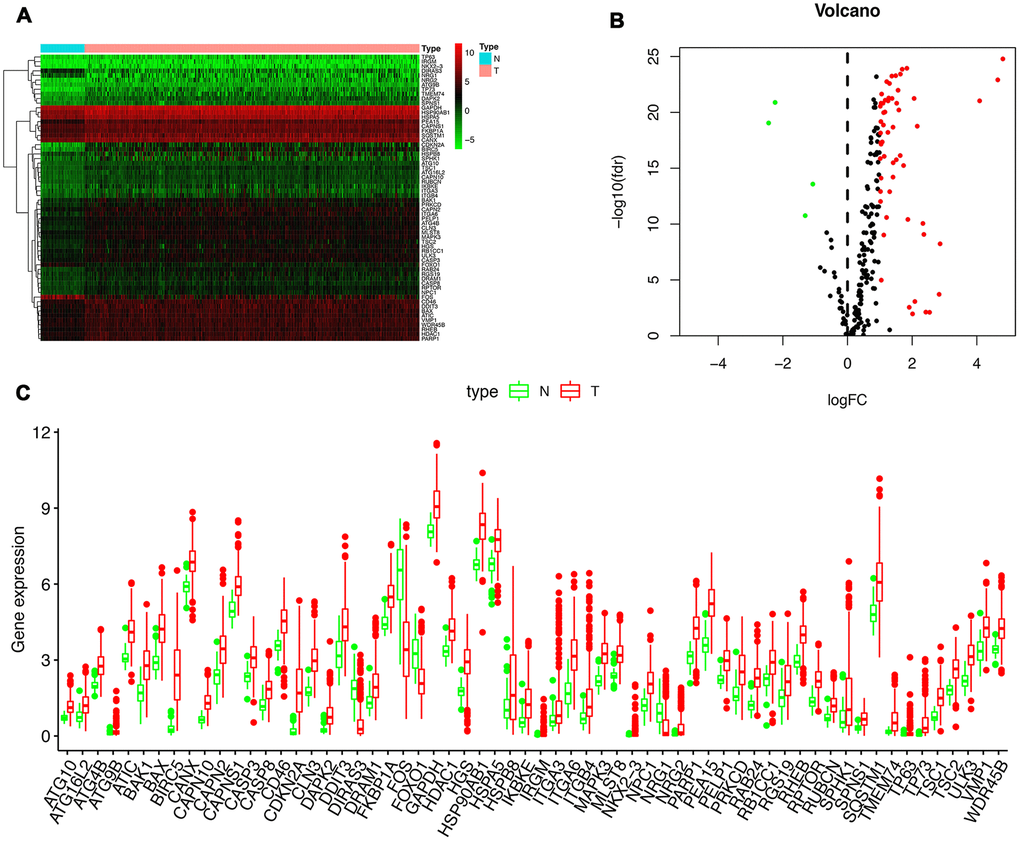
Figure 1.Differentially expressed autophagy-related genes (ARGs) between liver cancer (HCC) and normal liver tissues. Heatmap (A) and volcano map (B) were constructed showing the 62 differentially expressed autophagy-related genes in HCC tissues compared with normal tissue, with red dots representing significantly up-regulated genes, green dots representing significantly down-regulated genes, and black dots representing genes with no significant differences. (C) Expression of 62 ARGs that are differentially expressed in HCC tissues (each red dot represents a distinct tumor sample) as compared with the normal tissues (green dots). The upregulation of a distinct gene was marked as red bars, and the downregulation as green bars.