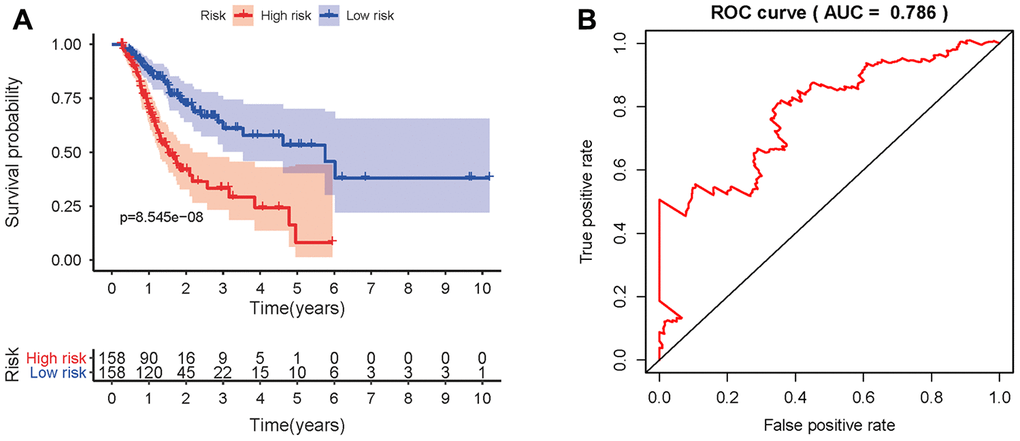
Figure 11.Prognostic value of the prognostic model. (A) Kaplan-Meier plot depicting the survival probabilities predicted by the prognostic model over time for the high- (red) and low-risk (blue) groups. (B) Survival-dependent ROC analysis of the prognostic value of the prognostic model.