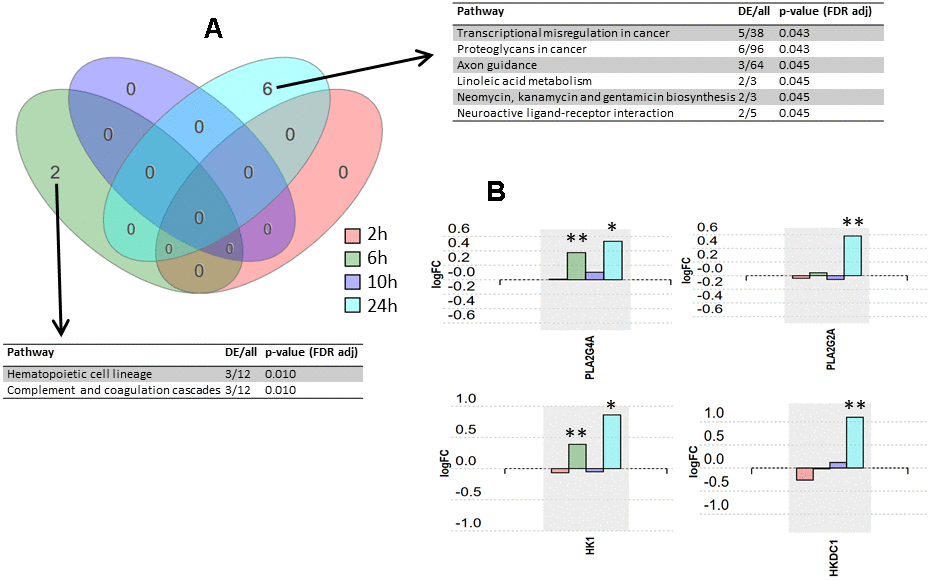
Figure 1.Pathway analysis results. (A) Venn diagram representing the intersections of pathway sets associated with the four post-infection time points. Pathways were considered significant according to a p-value calculated by iPathway Guide software using a hypergeometric distribution and adjusted using false discovery rate. DE, differentially expressed proteins. (B) Expression changes over four post-infection time points for proteins PLA2G4A, PLA2G2A, HK1, and HKDC1. * p-value < 0.05, ** p-value < 0.001.