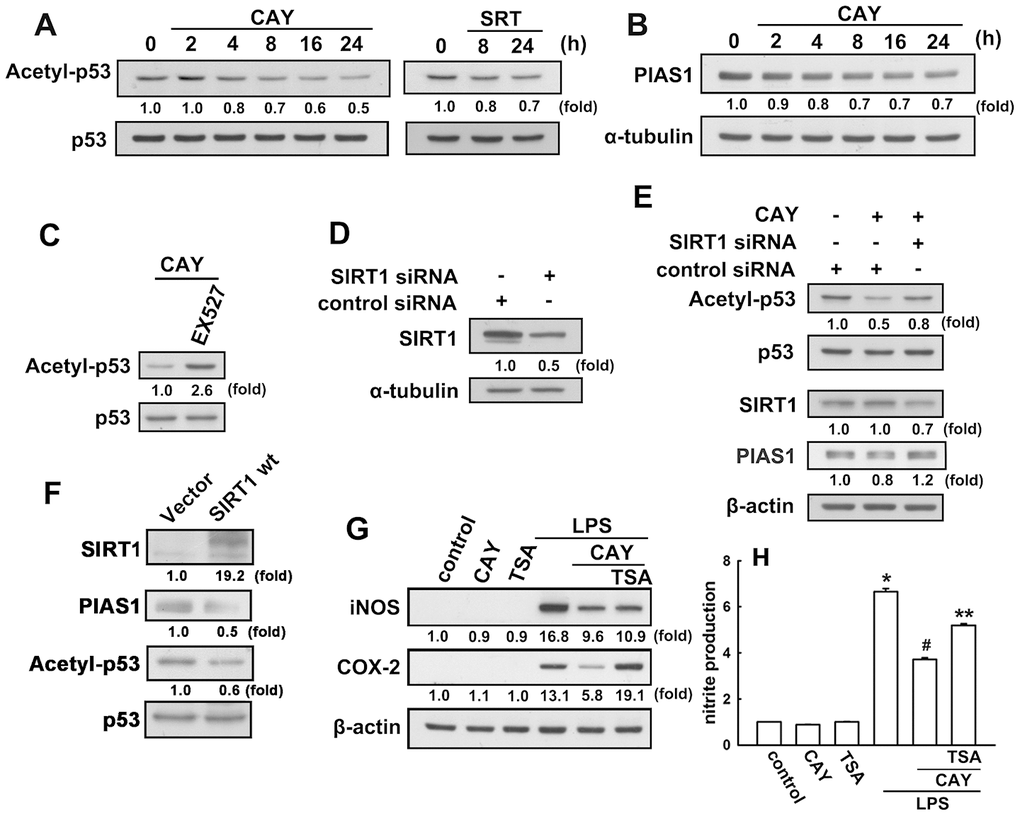
Figure 2.SIRT1 decreases lysine 379 acetylation of p53 in microglial cells. (A) BV-2 microglia were stimulated with CAY (5 μM) or SRT (1 μM) for the indicated time periods. The expression of K379 acetylated p53 was determined by western blot analysis. (Β) Microglial cells were stimulated with the SIRT1 activator, CAY (5 μM), for the indicated time periods (2–24 h). The expression of PIAS1 was determined by western blot analysis. (C) Microglial cells were treated with 10 μM EX527 (a SIRT1 inhibitor) for 30 min, followed by treatment with the SIRT1 activator, CAY (5 μM), for 24 h. Whole-cell lysate proteins were extracted and subjected to western blot analysis to assess lysine 379 acetylated p53. (D) After transfection of microglial cells with siRNA against SIRT1 or control for 24 h, the cells were lysed, proteins were extracted and the subjected to western blot analysis to assess SIRT1 expression. (E) Microglial cells were transfected with either siRNA against SIRT1 or control for 24 h, and then treated with CAY compound for another 24 h. Whole-cell lysate proteins were extracted and subjected to western blot analysis to assess acetylated p53, SIRT1, and PIAS1 expression. Similar results were obtained from at least three independent experiments. (F) IMG cells were transfected with empty vector or wild-type SIRT1 for 24 h, and the expression levels of SIRT1, PIAS1, acetyl-p53, and p53 were determined by western blot analysis. (G) After preincubation with TSA (10 nM) for 30 min, the SIRT1 activator, CAY (5 μM), was added for another 30 min before stimulation with LPS (100 ng·mL−1) for 24 h. The expression of iNOS and COX-2 was determined by western blot analysis, and the medium was collected to measure nitrite production (H). The results are presented as mean ± SEM of n = 3–4. * p < 0.05, compared with the control group; #, p < 0.05, compared with the LPS treatment group. **, p < 0.05 compared with the CAY plus LPS treatment group.