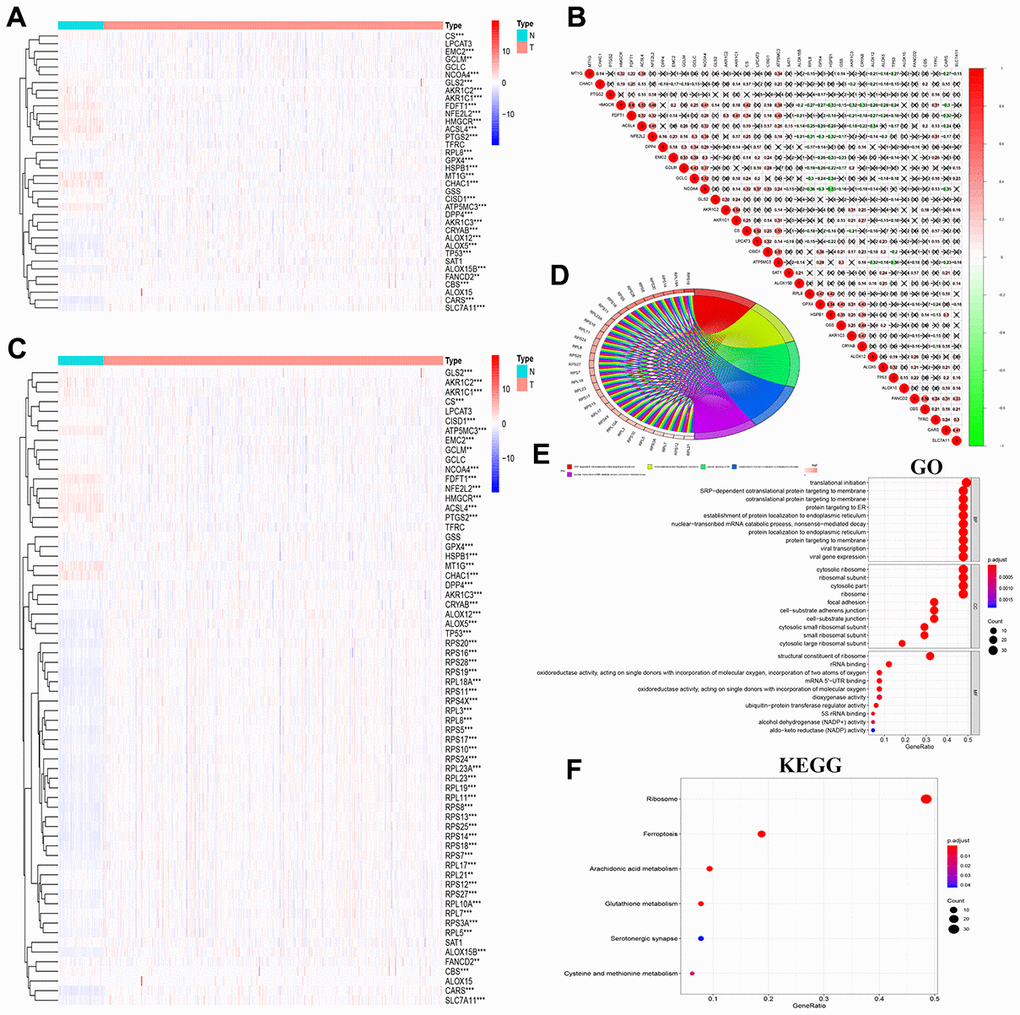
Figure 3.Correlation and functional pathway analysis of FRGs and FRG-related proteins in ccRCC. (A) The expression of 36 FRGs in ccRCC patient samples is shown. The upregulated FRGs are indicated in red and the downregulated FRGs are shown in blue. N represents tumor sample, T represents normal sample. (B) Co-expression analysis shows the correlation between the 36 FRGs based on their expression in ccRCC tissues. (C) The expression of 36 FRGs and 30 FRG-interacting proteins in ccRCC is shown with 72 normal kidney tissues and 539 tumor tissues. (D, E) GO terms representing biological processes for the 66 FRGs and FRG-interacting genes. (F) KEGG pathway analysis shows the main signaling pathways represented by the 66 FRGs and FRG-interacting genes. Note: *P < 0.05, **P < 0.01. ***P < 0.001.