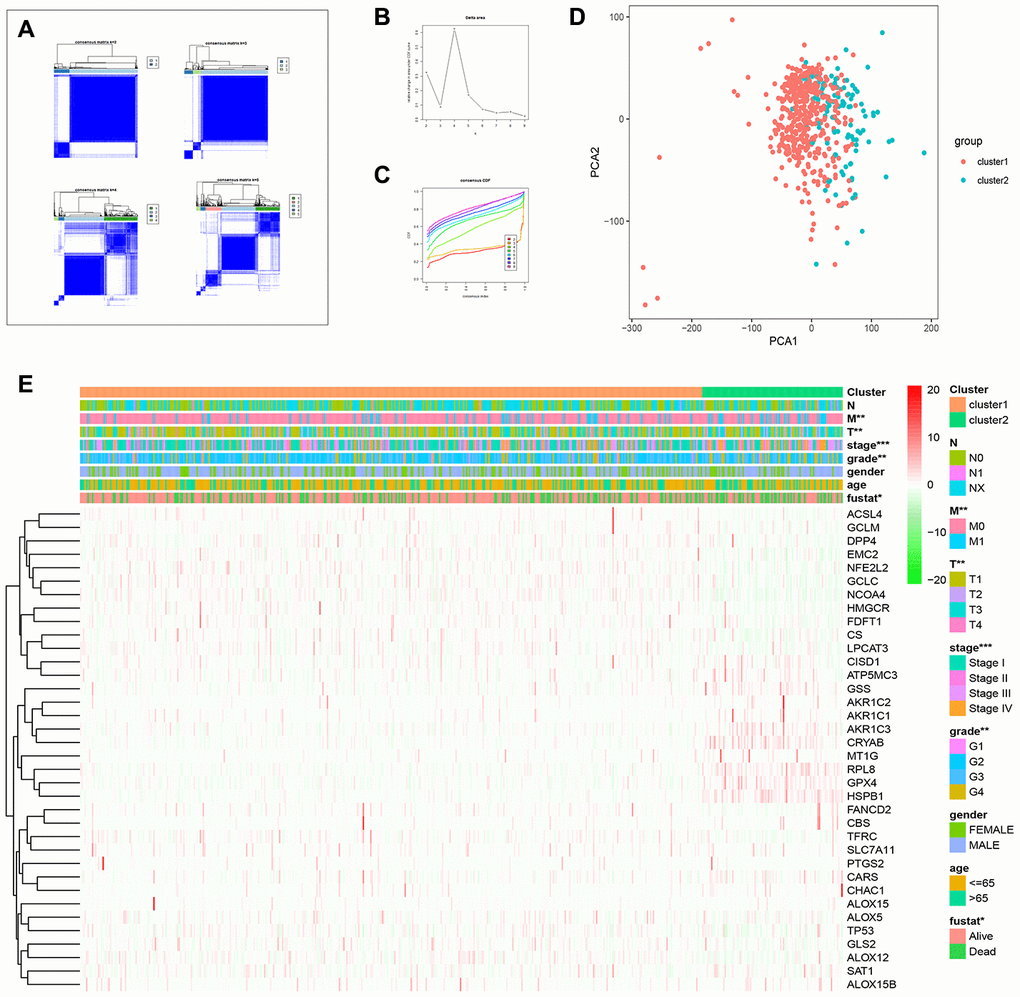
Figure 4.Consensus clustering analysis of FRGs in ccRCC. (A) The heat maps show the consensus clustering matrix for FRGs in the ccRCC dataset for k = 2, 3, 4 and 5. The optimal clustering is represented by k=2. (B) The cumulative distribution function (CDF) plot of consensus clustering matrix for k=2–9 is shown. (C) The consensus CDF plots show the cumulative distributive functions of the consensus matrix for k values (indicated by different colors) between 2 and 9. (D) Principal component analysis (PCA) of FRGs mRNA expression profiles of the ccRCC patients in the TCGA dataset demonstrates two patient clusters, cluster1 (in red) and cluster2 (in blue). (E) Heatmap shows the correlation between the expression of FRGs and the clinicopathological features of the two ccRCC patient clusters, cluster 1 (orange) and cluster 2 (green). The color codes for different clinicopathological parameters are as indicated. The expression of FRGs is also indicated by a color code bar, where red refers to high expression or upregulation and green refers to low expression or downregulation.