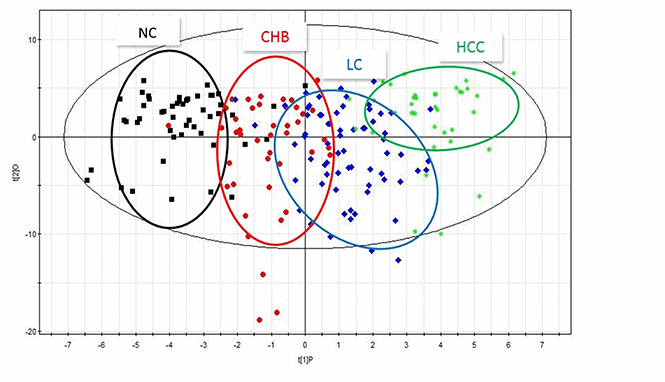
Figure 1.PLS-DA scatter plots of plasma samples from healthy volunteers, patients with CHB, LC and HCC. Black represents health, red represents CHB, blue represents LC, green represents HCC.
Figure 1 — Analysis of plasma metabolic profile, characteristics and enzymes in the progression from chronic hepatitis B to hepatocellular carcinoma | Aging