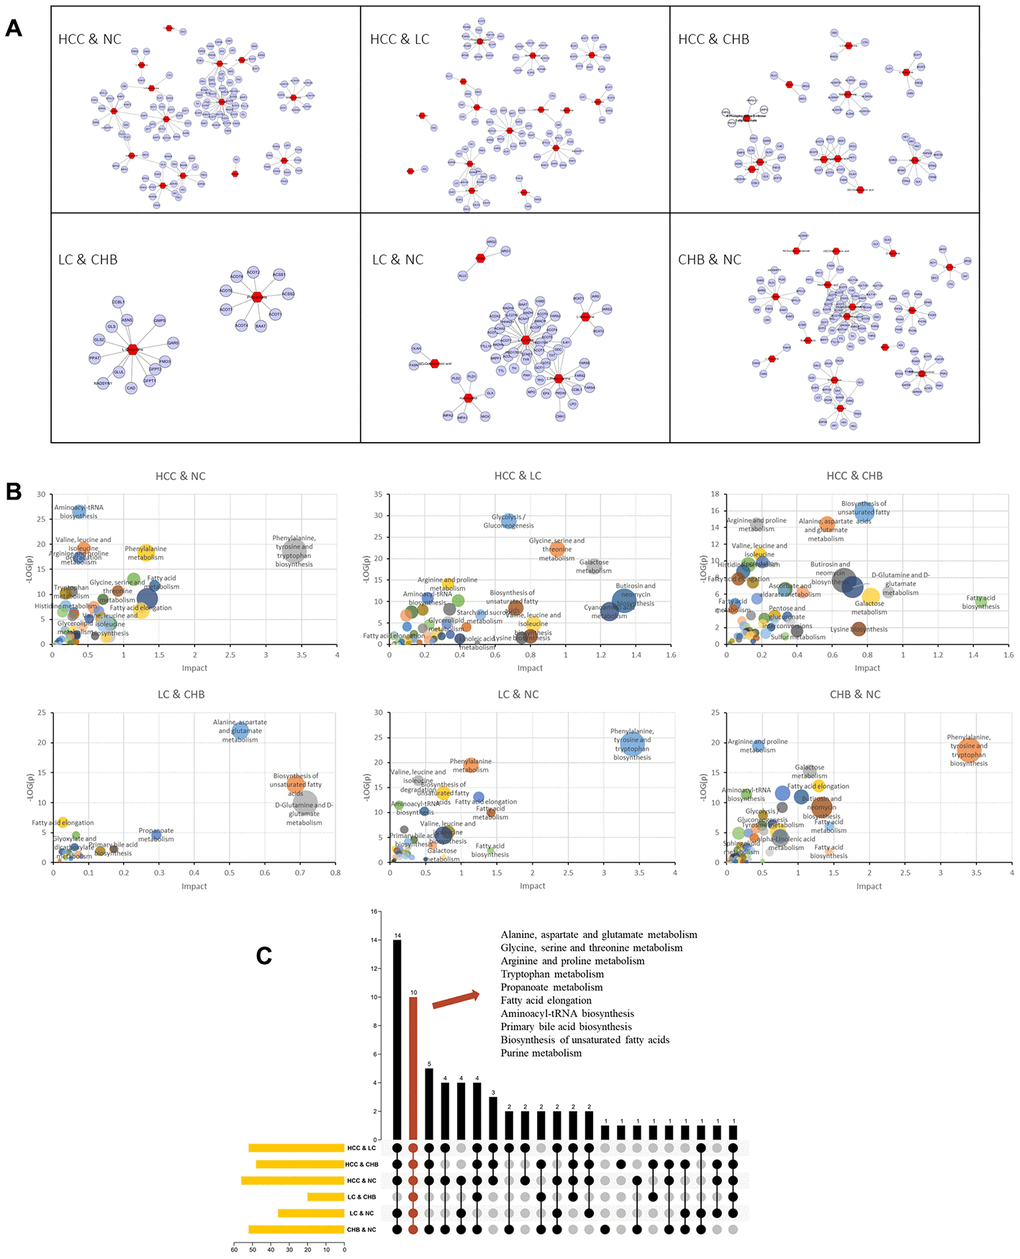
Figure 3.Genes and KEGG pathways related to DMs. (A) DM-gene interaction networks. The red triangles represent DMs. The blue circles represent metabolic enzyme genes. (B) Jointly pathway of DMs and related genes. Abscissa represents the pathway impact. Ordinate represents -log (p). (C) Upset plot presents the common KEGG pathways among NC, CHB, LC and HCC. The bar chart at the bottom left represents the number of pathways included in each group. The yellow bar chart above represents the number of common pathways in each intersection. Red indicates the intersection of all group.