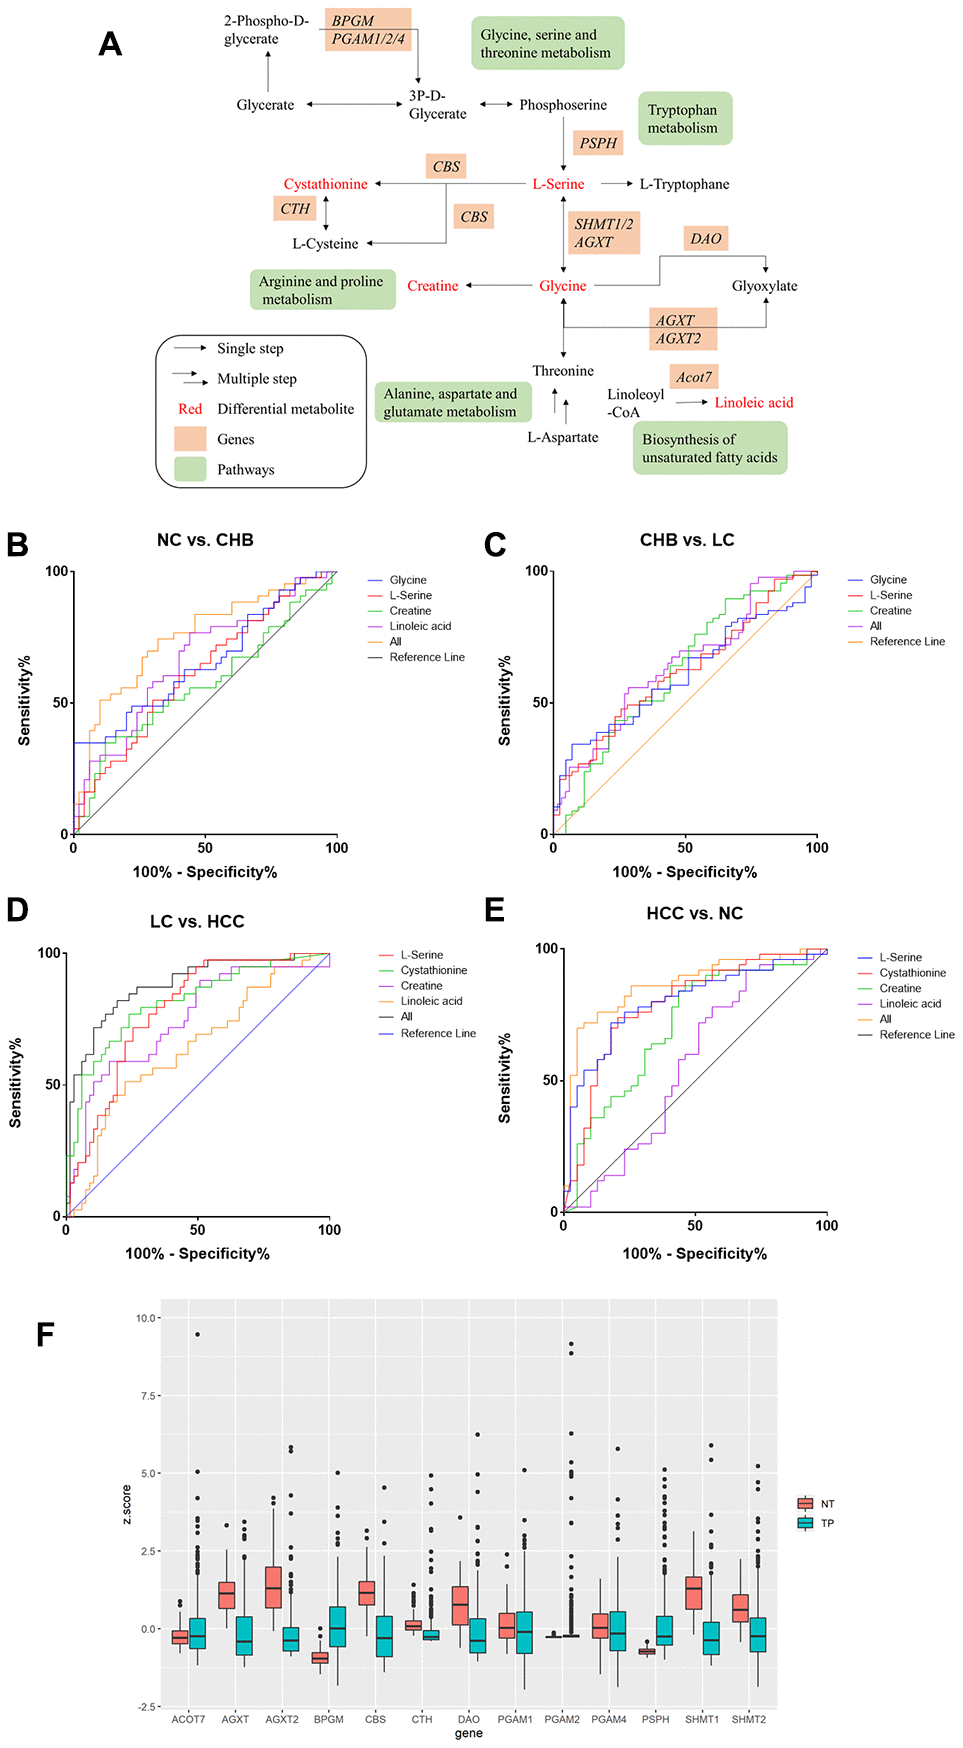
Figure 4.Metabolic pathway network analysis and expression of candidate metabolic enzyme mRNAs in HCC A. (A) schematic representation of metabolic pathway network. (B–E). ROC curves of DMs panels between NC and CHB, CHB and LC, LC and HCC, HCC and NC respectively. (F) The expression of candidate genes in liver cancer from TCGA-LIHC database (377 patient samples). NT: solid tissue normal, TP: primary solid tumor.