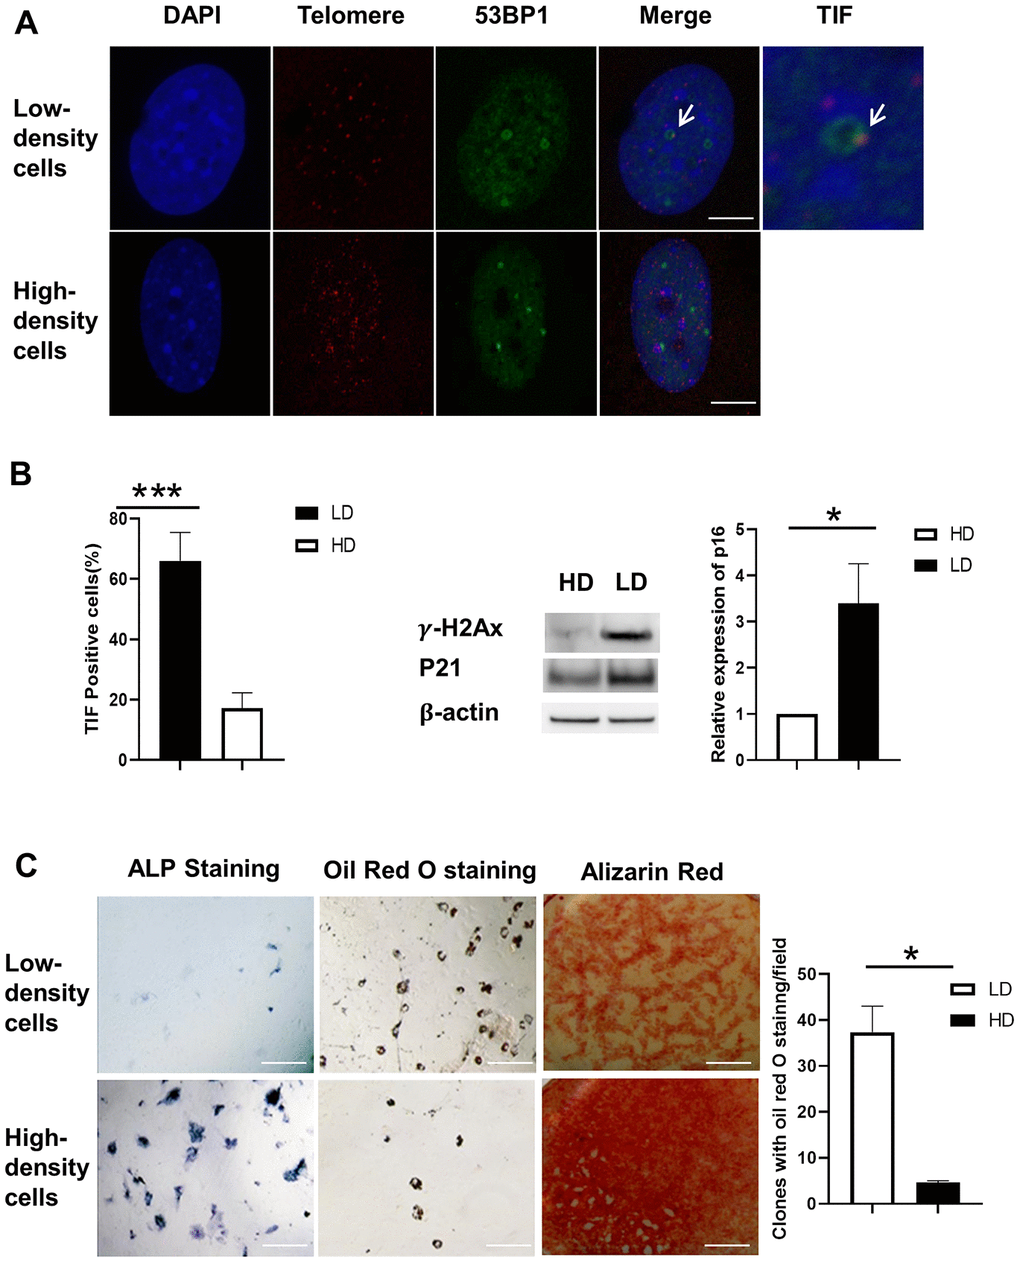
Figure 3.Differentiation capacity and TIF assay of BMSCs after separation. (A) Co-localization of 53BP1 DNA damage protein (green) and telomeric DNA (red). TIFs are indicated by arrows. Blue, DAPI; Red, Telomere; Orange/Yellow, TIFs. Scale Bar=5μm. (B) The percentage of TIF-positive cells is substantially lower in high-density cells compared to low-density cells (left panel). The protein levels of γH2AX and P21 were induced at low density (LD) using Western blot. P16 gene expression was increased at LD using real-time PCR. (C) Low- and high-density cells were cultured either in osteogenic induction medium or adipogenic induction medium for 7 days. ALP and oil red O staining were conducted at the end of 14 days. ALP staining (upper- and lower-left panels) was induced in the high-density cell group. Oil red O staining (upper- and lower-middle panels) was induced in the low-density cell group. Alizarin red staining (upper- and lower-right panels) was induced in the high-density cell group. Quantification of clones of oil red O staining positive (n=3) is shown in the graph at right. ALP indicates alkaline phosphatase; DAPI, 4′,6-diamidino-2-phenylindole; HD, high density; LD, low density; TIF, telomere dysfunction-induced foci. Paired T-Test, ***, P<.001, data are represented as mean ± SEM. Scale Bar=200μm.