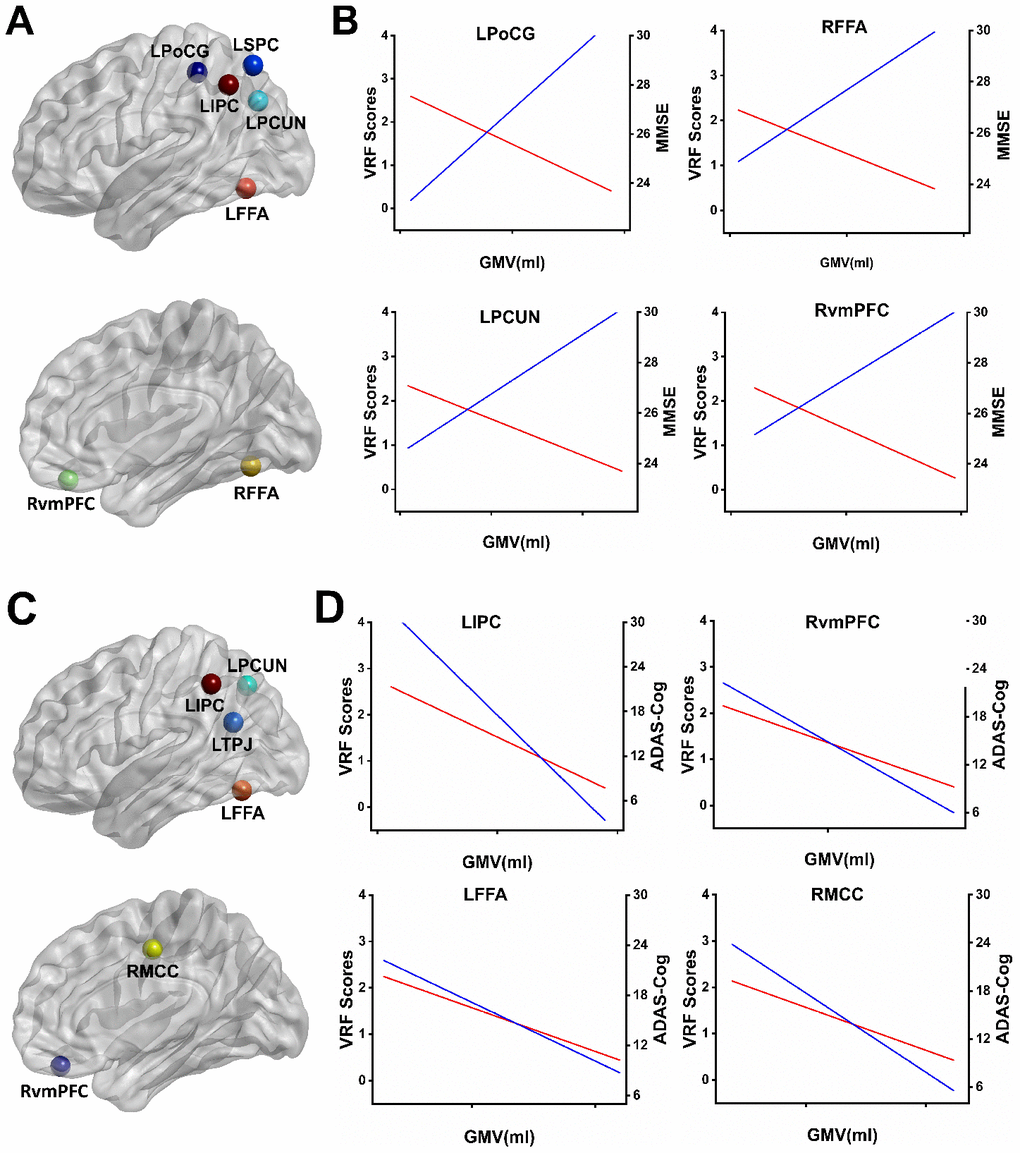
Figure 3.Overlapping regions from the effects of VRFs on GMV and the correlates of cognitive performance influenced by GMV. (A) Mapping the overlapping regions from the accumulating effects of VRFs on GMV and the neural correlates of the MMSE on GMV in the AD spectrum. (B) Representative illustration of the relationship among the VRF scores, GMV, and MMSE scores in the overlapped regions. The results indicate that higher VRF scores are associated with more GM atrophy (red lines) and a lower MMSE performance (blue lines). (C) Mapping the overlapped regions from the accumulating effects of VRFs on GMV and the neural correlates of the ADAS-Cog on GMV in the AD spectrum. (D) Representative illustration of the relationship among the VRF scores, GMV, and ADAS-Cog scores in the overlapped regions. The results indicate that higher VRF scores are associated with more GM atrophy (red lines) and a higher ADAS-Cog performance (blue lines). Abbreviations: LSPC, left superior parietal cortex; LPoCG, left postcentral gyrus; LIPC, left inferior parietal cortex; LPCUN, left precuneus; LFFA, left fusiform face area; RvmPFC, right ventromedial prefrontal cortex; RFFA, right fusiform face area; LTPJ, left temporoparietal junction; RMCC, right middle cingulate cortex; MMSE, Mini-Mental State Examination; ADAS-Cog, Alzheimer's Disease Assessment Scale-Cognitive Subscale; GMV, gray matter volume; VRF scores, vascular risk factor scores.