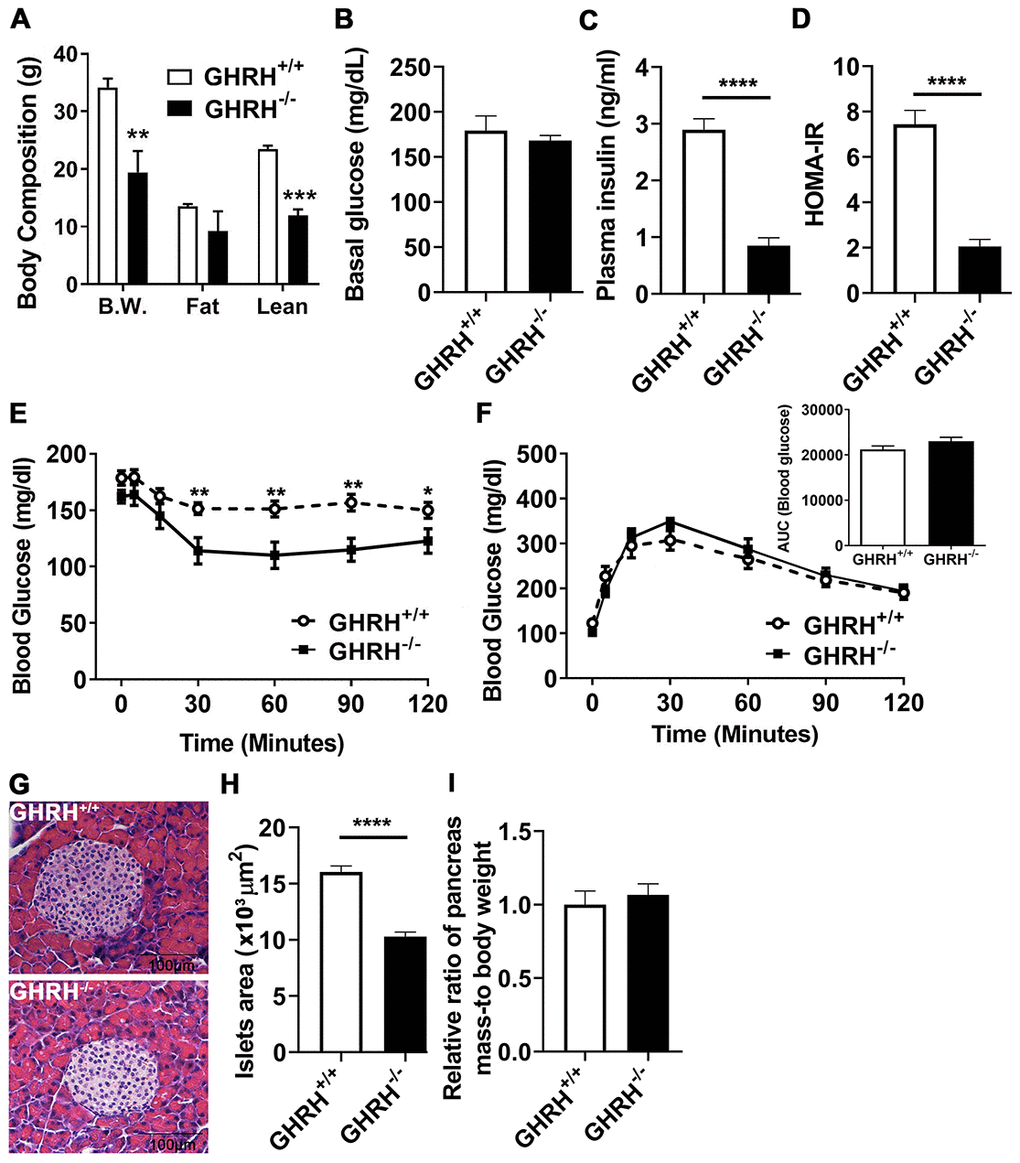
Figure 1.Glucose homeostasis and insulin sensitivity in GHRH-/- mice. (A) Body composition. (B–D) 4-hour fasted glucose, plasma insulin and homeostatic model for assessment of insulin resistance (HOMA-IR). (E) Intraperitoneal insulin tolerance test (IPITT). 4 hours fasted mice were i.p. injected with porcine insulin (1 IU/kg of body weight). (F) Intraperitoneal glucose tolerance test (IPGTT) and area under the curve analysis (AUC). 16 hours fasted mice were i.p. injected with glucose (1 g/ kg of body weight). (G) Representative photomicrographs of pancreatic islet sections stained with H&E staining. Scale bar is 100 μm. (H) Average of pancreatic islets. Total 50 pancreatic islets from 5 mice for each genotype were quantitated. (I) Relative ratio of pancreas mass (g) versus whole body weight (g). Data (means ± sem) was expressed as fold change compared to WT controls (defined as 1.0). All data were represented as the means ± sem (n=14 in each genotype for IPITT and IPGTT; n=8 in each group for fasted glucose, plasma insulin and HOMA-IR; n=5 in each genotype for evaluation of average pancreatic islets and relative ratio of pancreas mass). Statistical analysis was performed by unpaired Student’s t-test, * P < 0.05, ** P < 0.01 and **** P < 0.0001.