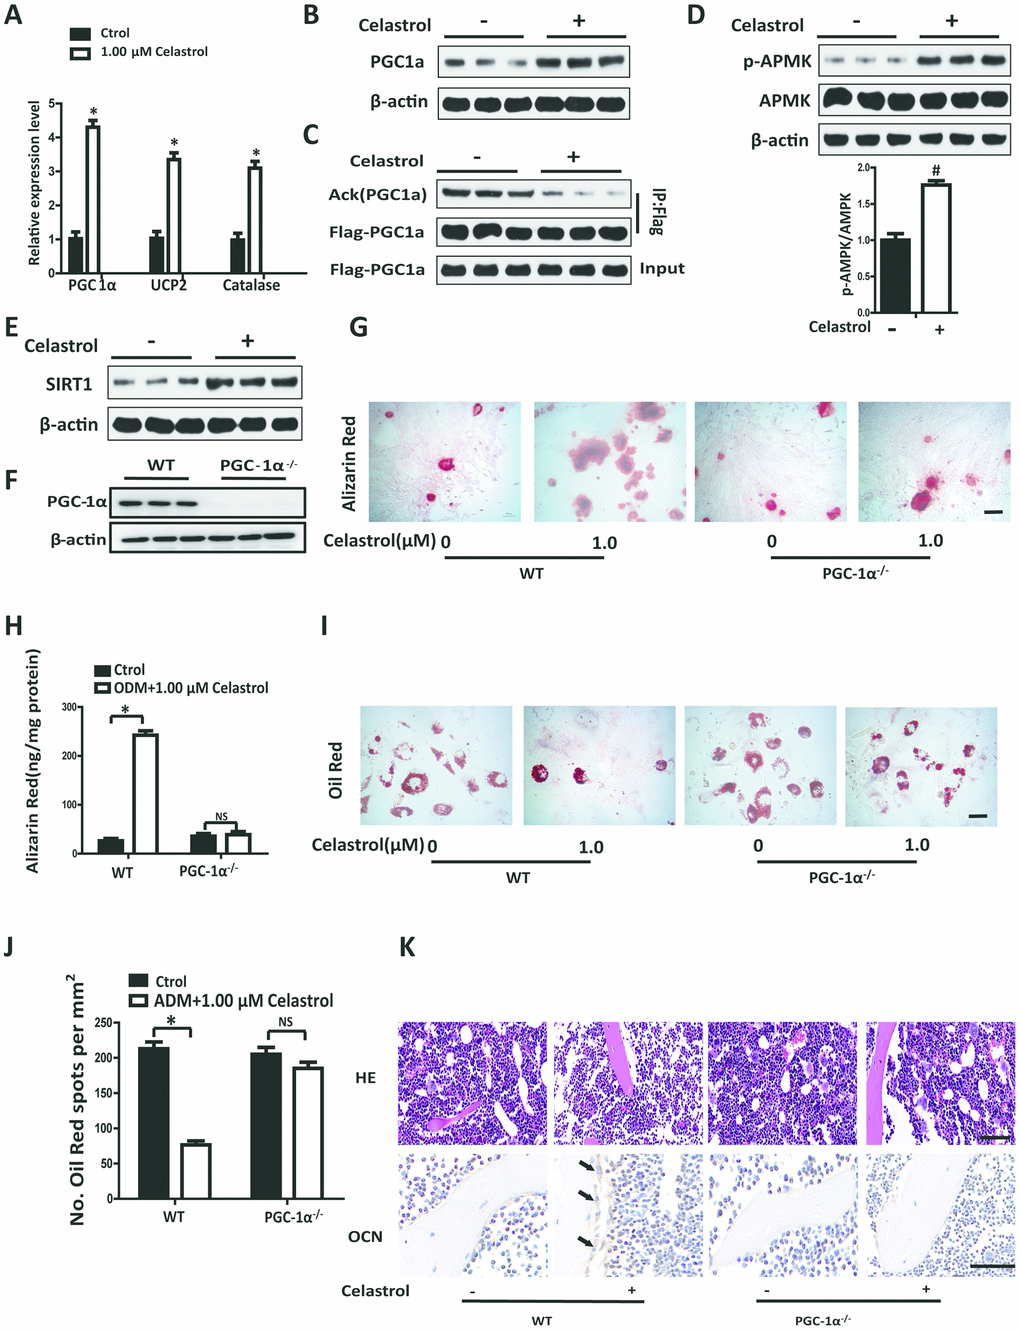
Figure 3.Celastrol regulated the differentiation of BM-MSCs by activating PGC-1α signaling. (A) Expression levels of PGC-1α, UCP2 and Catalase in BM-MSCs treated with the vehicle or Celastrol (1.0 μM, 48 hours) (n = 3 per group). (B) Western blotting analysis of the protein levels of PGC-1α of BM-MSCs treated with the vehicle or Celastrol (1.0 μM, 48 hours). (C) Western blotting analysis for the detection of PGC1α acetylation levels in PGC1α immunoprecipitates obtained from BM-MSCs transfected with pcDNA-Flag-PGC1α and treated with the vehicle or Celastrol (1.0 μM, 48 hours). (D) Western blotting analysis for the detection of pAMPK in BM-MSCs treated with the vehicle or Celastrol (1.0 μM, 48 hours). The levels of pAMPK were quantified using ImageJ software and were normalized to total AMPK levels (D, bottom). (E) Western blotting analysis of the protein levels of SIRT-1 in BM-MSCs treated with the vehicle or Celastrol (1.0 μM, 48 hours). (F) Western blotting analysis of the relative levels of PGC-1α in BM-MSCs transfected with PGC-1α siRNA. (G, H) Representative images of Alizarin Red staining (G) and quantitative analysis (H) of matrix mineralization of BM-MSCs cultured in the osteogenesis induction medium for 21 days. Scale bar: 100 μm. (I, J) Representative images of Oil Red O staining of lipids (I) and quantification of the number of spots (J) on BM-MSCs cultured in the adipogenesis induction medium for 14 days. Scale bar: 100 μm. (K) PGC-1α-knockout (PGC-1α-/-) mice (2 month old) and WT mice (2 month old) were ovariectomized. 12 weeks later, they were intraperitoneally injected with Celastrol (200 μg/kg) or DMSO (control) every two days for 4 weeks. H&E staining (top) and osteocalcin immunohistochemical staining (bottom) of the bone were conducted to evaluate the numbers and area covered by adipocytes and osteoblasts after Celastrol treatment. Scale bar: 100 μm. Data are presented as mean ± SD. Statistical significance was determined using the t-test. *P < 0.0001; #P < 0.001 compared with control.