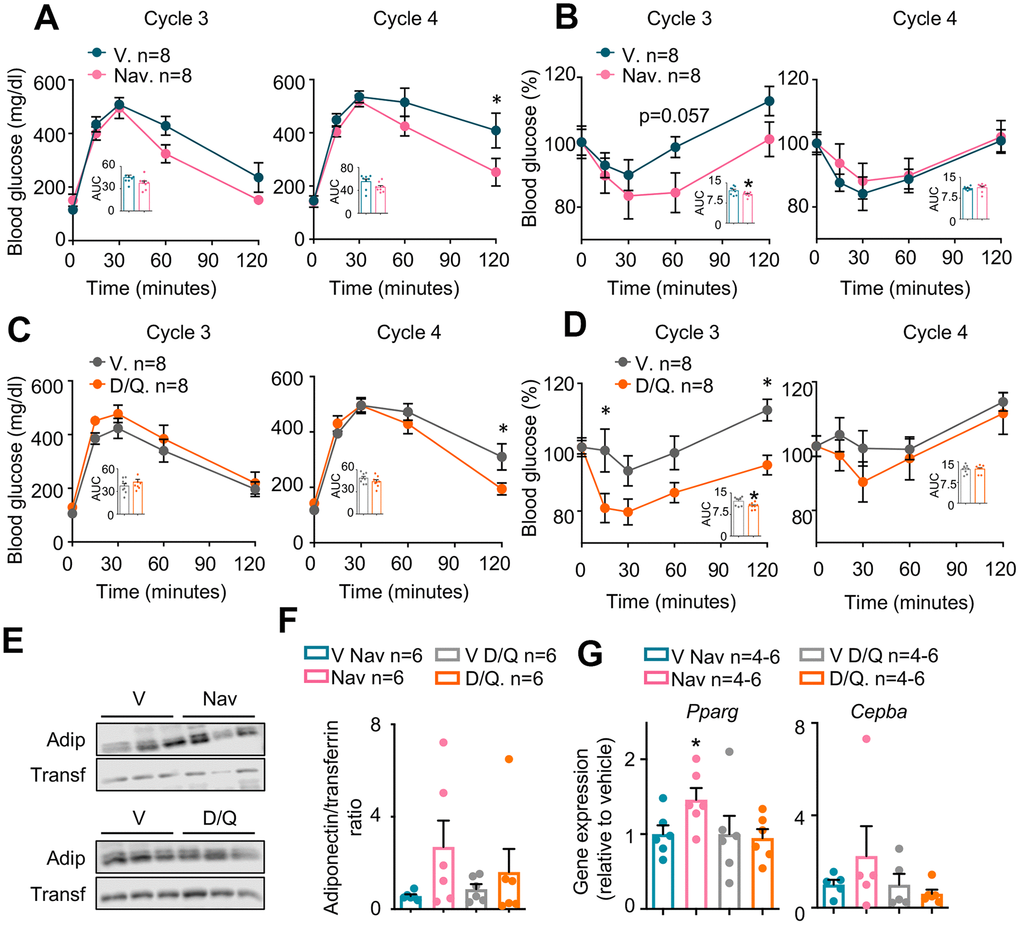
Figure 3.Metabolic phenotyping of mice treated with senolytics. Glucose (A and C) and insulin (B and D) tolerance tests performed at the indicated cycles. The area under the curve (AUC) was calculated for each experiment and represented in the insets. (E) Representative examples (n=3 from a total of n=6) of Western blots of the indicated proteins from plasma obtained at cycle 4 from the same mice shown in (A–D). (F) Quantification of Western blots for adiponectin, including those represented in (E), from all available plasma samples from mice shown in (A–D) (n=6). (G) mRNA expression analysis of the indicated genes in pWAT obtained at the day of sacrifice. Bars and dots represent the average of the indicated number of mice per group. Error bars represent the standard error of the mean. Statistical significance was assessed by the two-way ANOVA test with Sidak’s correction for multiple comparisons for the time course experiments (main graphs at A–D); and with the two-tailed unpaired Student's t-test for the AUC data (A–D) and for panels E and F. Asterisks refer to the comparison with the corresponding vehicle-treated mice. *, p<0.05.