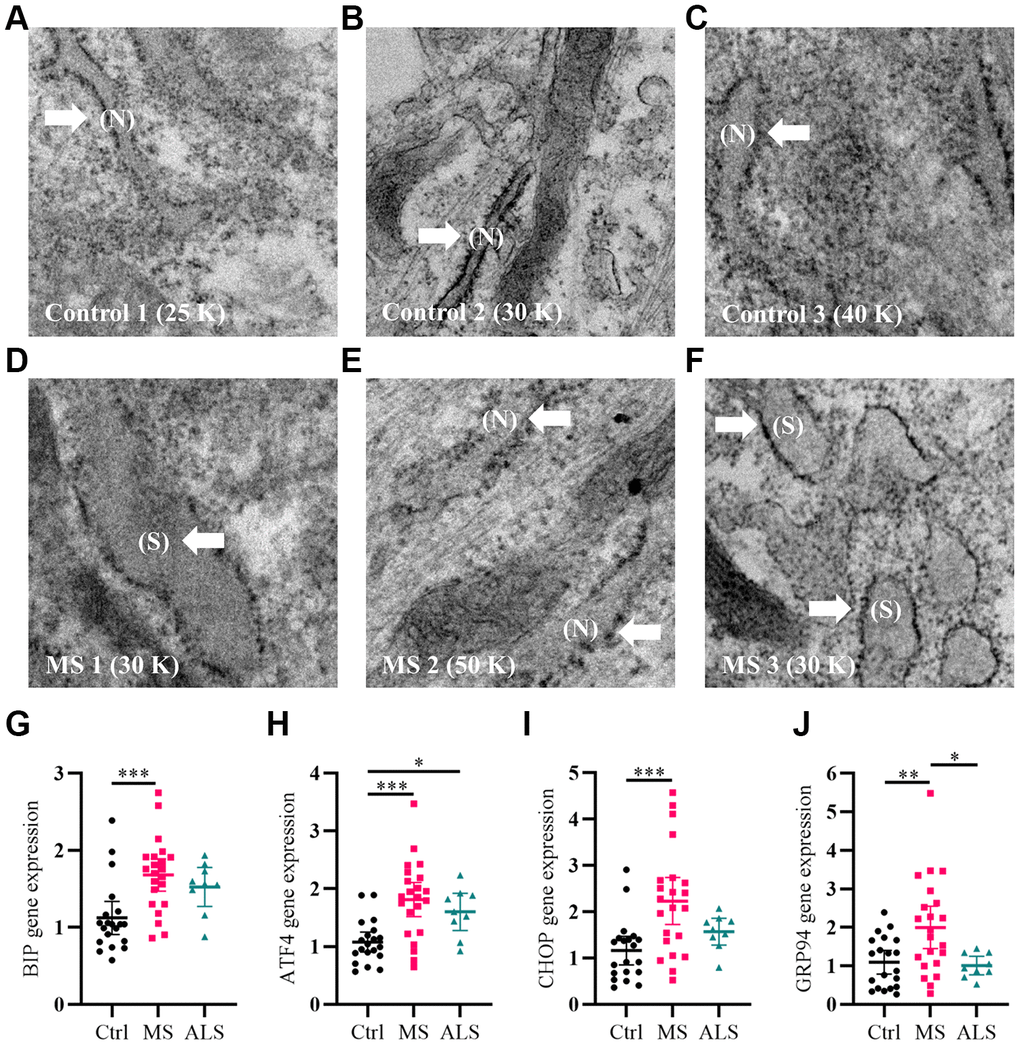
Figure 1.Signatures of ER stress are increased in MS skin fibroblasts. (A–F) Skin fibroblasts were imaged using electron microscopy. Representative images of three different skin fibroblasts from (A–C) control and (D–F) MS individuals are shown. Arrows point to (N, normal) or (S, swollen) ER. (G–J) Gene expression levels of BIP, ATF4, CHOP, and GRP94 were determined using RT-PCR. Detected gene expression levels were normalized to the reference gene β-actin. Each point represents a unique skin fibroblast (Ctrl, n = 20; MS, n = 22; ALS, n = 9). The average of replicates is shown with the 95% confidence interval. Significance between groups was determined using one-way ANOVA post hoc Tukey test. *, P < 0.05; **, P < 0.01; and ***, P < 0.001. Abbreviations: ALS, amyotrophic lateral sclerosis; Ctrl, control; ER, endoplasmic reticulum; MS, multiple sclerosis; N, normal; S, swollen.