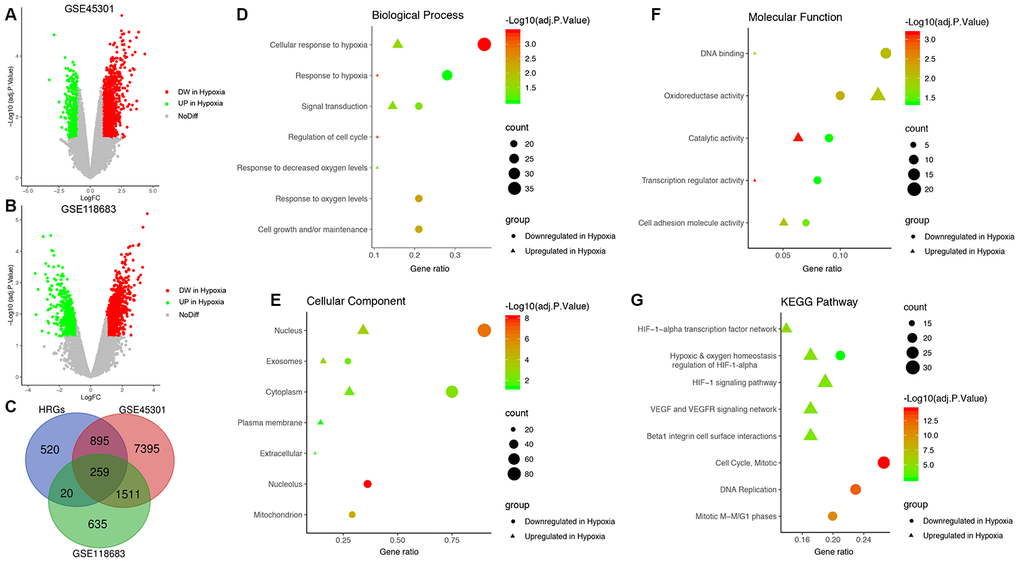
Figure 1.Identification of glioblastoma (GBM)-specific hypoxia-related genes (HRGs) and enrichment analysis. (A) Volcano plot of differentially expressed genes (DEGs) between normoxic and hypoxic cultured GBM cells in GSE45301. (B) Volcano plot of DEGs between normoxic and hypoxic cultured GBM cells in GSE118683. The vertical axis indicates the -log [adjusted P value (adj. P value)], and the horizontal axis indicates the log2 [fold change (FC)]. The red dots represent downregulated genes under hypoxic conditions, and the green dots represent upregulated genes under hypoxic conditions (adj. P value <0.01 and |log2(FC)|>1). (C) Venn diagram of the 259 GBM-specific HRGs, which are the genes in the intersection of the HRGs from MSigDB and the DEGs of GSE45301 and GSE118683. Biological processes (D), cellular components (E), molecular functions (F) and Kyoto Encyclopedia of Genes and Genomes (KEGG) pathways (G) enriched in the GBM-specific HRGs.