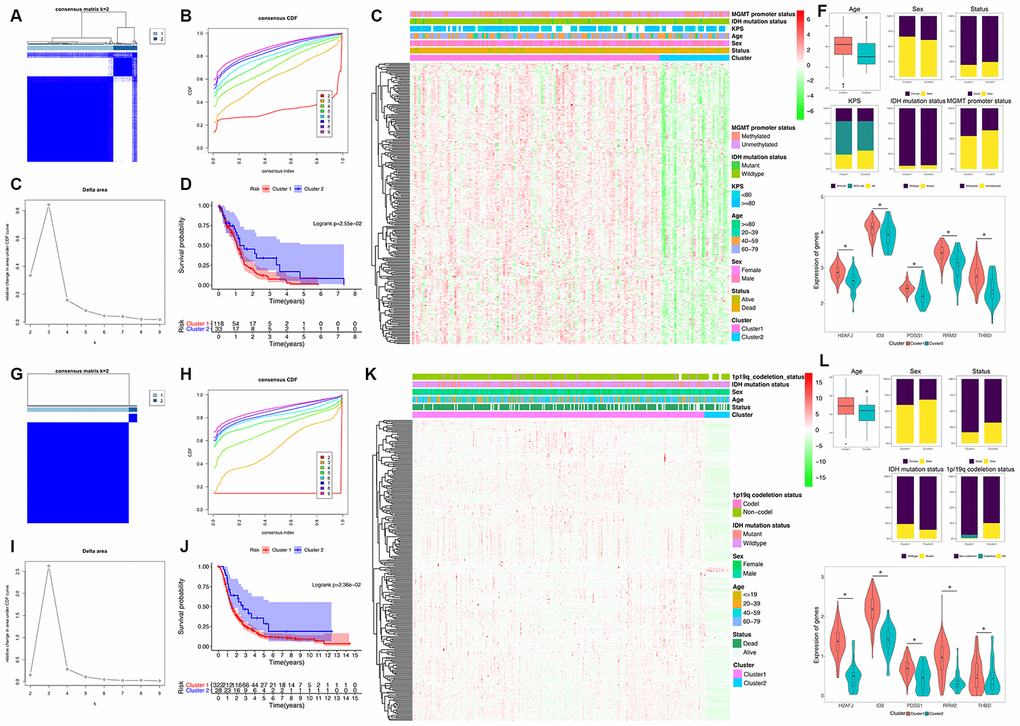
Figure 2.Identification and validation of an HRG-based molecular classification of GBM patients using the unsupervised consensus clustering algorithm. Consensus clustering matrix for k = 2, which was the optimal cluster number in the TCGA training cohort (A) and CGGA validation cohort (G). Cumulative distribution function (CDF) curves of the consensus score (k = 2-9) in the TCGA (B) and CGGA cohorts (H). The relative change in the area under the CDF curve (k = 2-9) in the TCGA (C) and CGGA cohorts (I). Kaplan-Meier (K–M) survival analyses of the patients in the Cluster 1 and Cluster 2 subgroups in the TCGA (D) and CGGA cohorts (J), which indicated that the patients in Cluster 1 had poorer OS than those in Cluster 2. The heatmap and clinicopathological features of the two clusters based on the expression patterns of the HRGs in the TCGA (E) and CGGA cohorts (K). The distributions of the clinicopathological factors and the expression patterns of the five HRGs included in the hypoxia signature between the two clusters of GBM patients in the TCGA (F) and CGGA cohorts (L). Upper and middle panel (F and L): Patients in Cluster 1 were older in both the training (P=0.024) and validation cohorts (P=0.047). No significant differences in the other clinicopathological factors were observed between the two clusters (all P>0.05). Bottom panel (F and L): The expression levels of the five HRGs were significantly higher in Cluster 1 than in Cluster 2 (all P<0.05) in both the training and validation cohorts. Asterisk means P<0.05 between two groups.