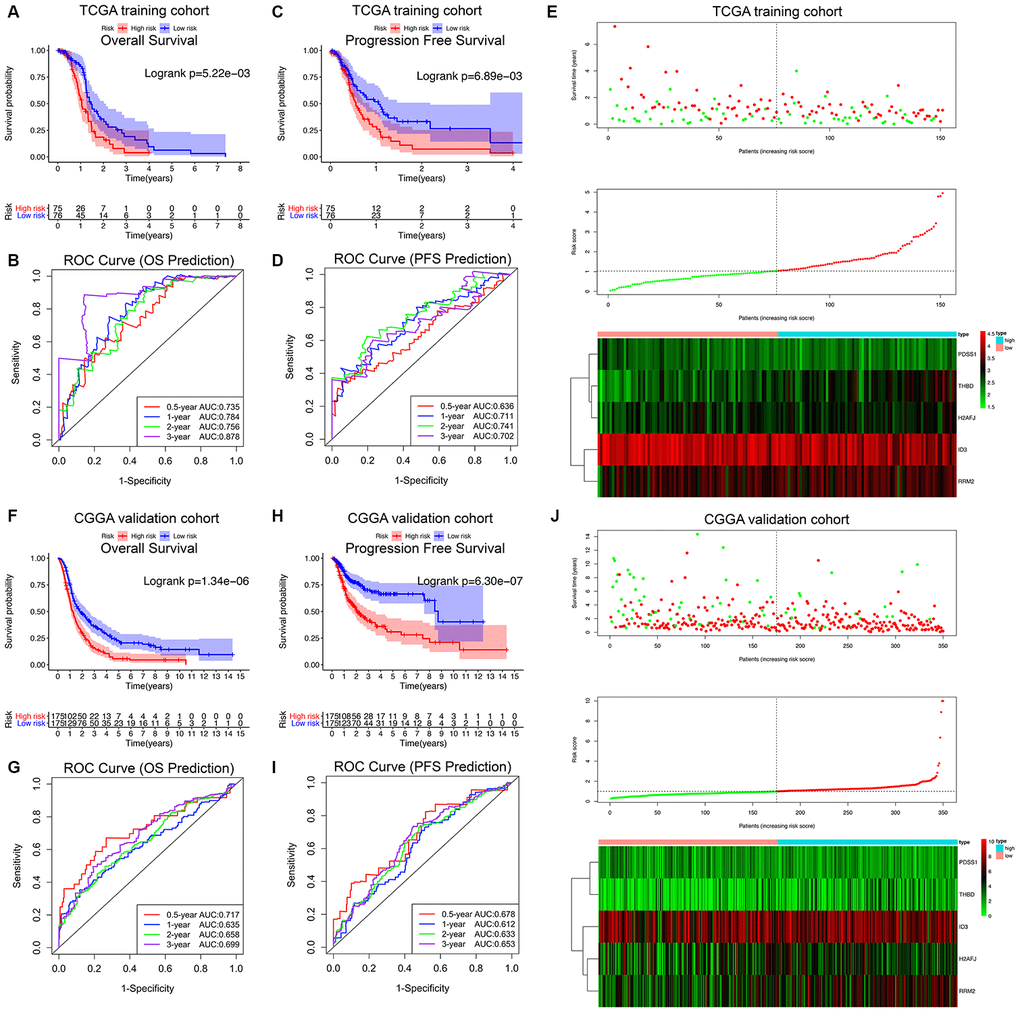
Figure 3.Survival analysis, prognostic performance and risk score analysis of the HRG-based risk score model in GBM patients. K-M survival analysis was performed to estimate the overall survival (OS) of high-risk and low-risk patients in the TCGA training cohort (A) and CGGA validation cohort (F). Additionally, K-M survival analysis was also performed to estimate the progression-free survival (PFS) of high-risk and low-risk patients in the TCGA (C) and CGGA cohorts (H). The high-risk groups had significantly poorer OS and PFS rates than the low-risk groups. The prognostic performance of the hypoxia signature demonstrated by the time-dependent ROC curve for predicting the 0.5-, 1-, 2-, and 3-year OS rates in the TCGA (B) and CGGA cohorts (G). The prognostic performance of the hypoxia signature demonstrated by the time-dependent ROC curve for predicting the 0.5-, 1-, 2-, and 3-year PFS rates in the TCGA (D) and CGGA cohorts (I). Risk score analysis of the hypoxia signature in the TCGA (E) and CGGA cohorts (J). Upper panel (I and J): Patient survival status and time distributed by risk score. Middle panel (I and J): Risk score curves of the hypoxia signature. Bottom panel (I and J): Heatmaps of the expression levels of the 5 HRGs in the GBM samples. The colors from green to red indicate the expression level from low to high.