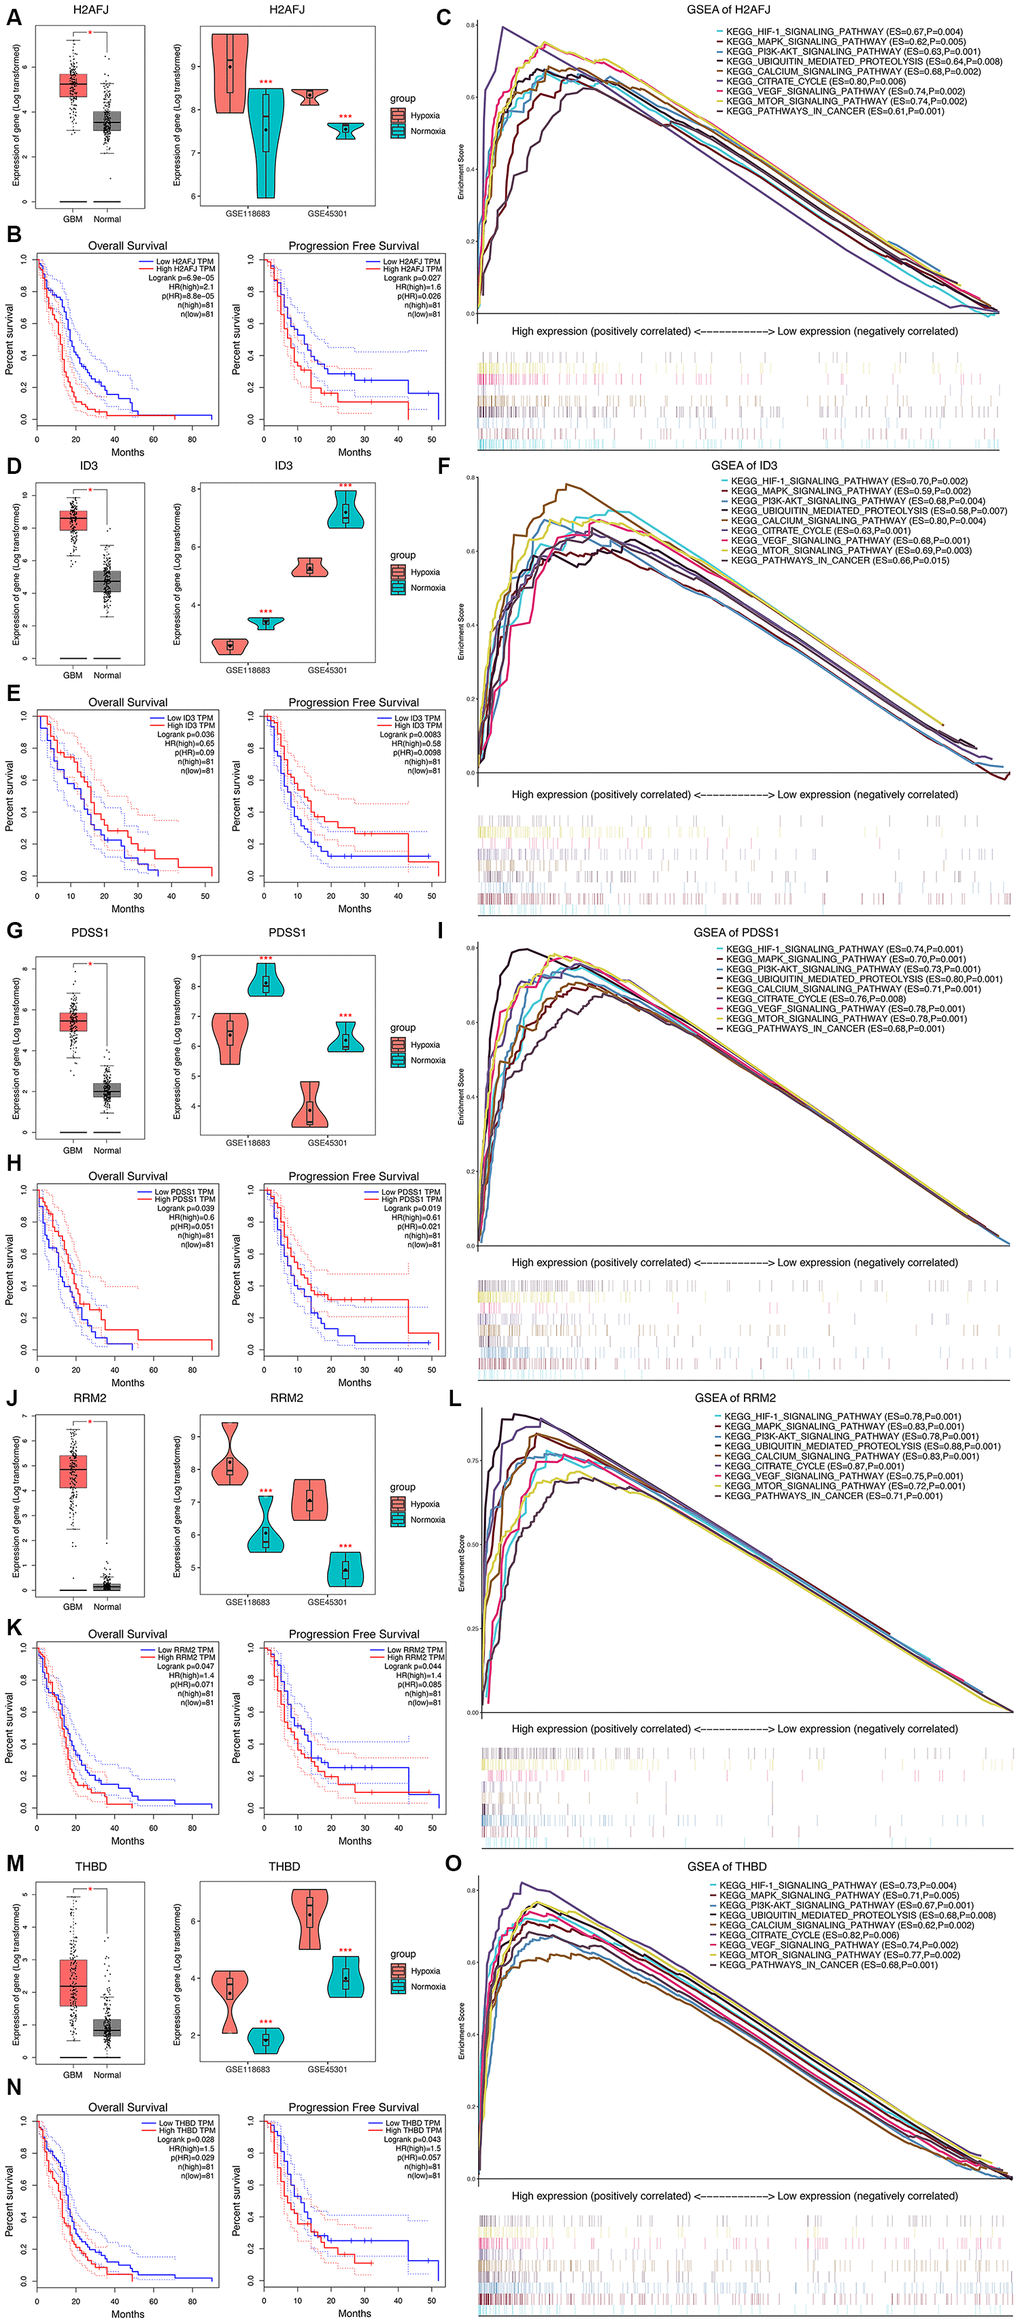
Figure 6.Expression analysis, survival analysis, and gene set enrichment analysis (GSEA) of the 5 HRGs in the hypoxia signature. Expression analysis of H2AFJ (A), ID3 (D), PDSS1 (G), RRM2 (J), and THBD (M). Left panel: Expression levels of the 5 HRGs in 163 GBM samples and 207 normal samples. Right panel: Expression levels of the 5 HRGs in hypoxia and normoxia cultured GBM cells from GSE118683 and GSE45301. Red asterisks mean P < 0.05 between two groups. (K–M) survival analysis of H2AFJ (B), ID3 (E), PDSS1 (H), RRM2 (K), and THBD (N). Left panel: K-M survival analysis was performed to estimate the OS of GBM patients with high and low expression levels of the corresponding HRG. Right panel: (K–M) survival analysis was performed to estimate the PFS of GBM patients with high and low expression levels of the corresponding HRG. GSEA of H2AFJ (C), ID3 (F), PDSS1 (I), RRM2 (L), and THBD (O) in the TCGA GBM cohort. The enriched KEGG pathways of the 5 HRGs are listed in the upper right. ES, enrichment score; P, nominal P value.