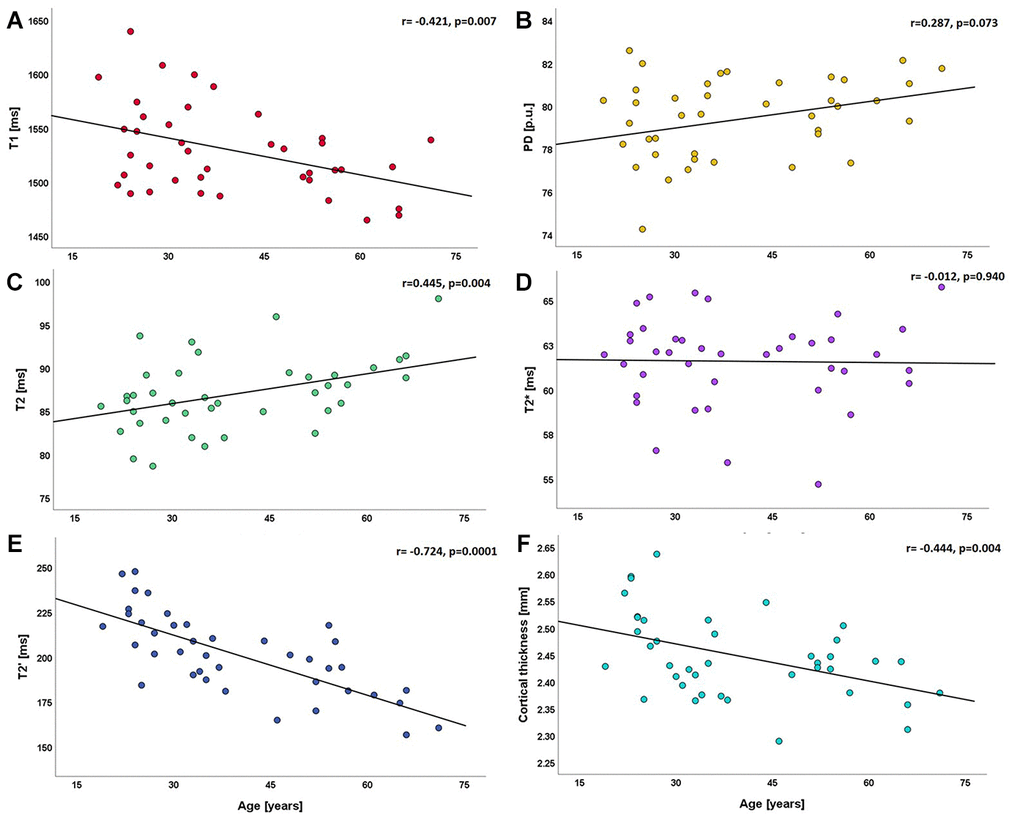
Figure 1.Scatterplots illustrating the relationship between global cortical qMRI parameters/cortical thickness and age. (A) relationship between T1 and age; (B) relationship between PD and age; (C–E) relationships of T2, T2* and T2' with age; (F) relationship between cortical thickness and age. ms: milliseconds; p.u.: percentage units; mm: millimeters.