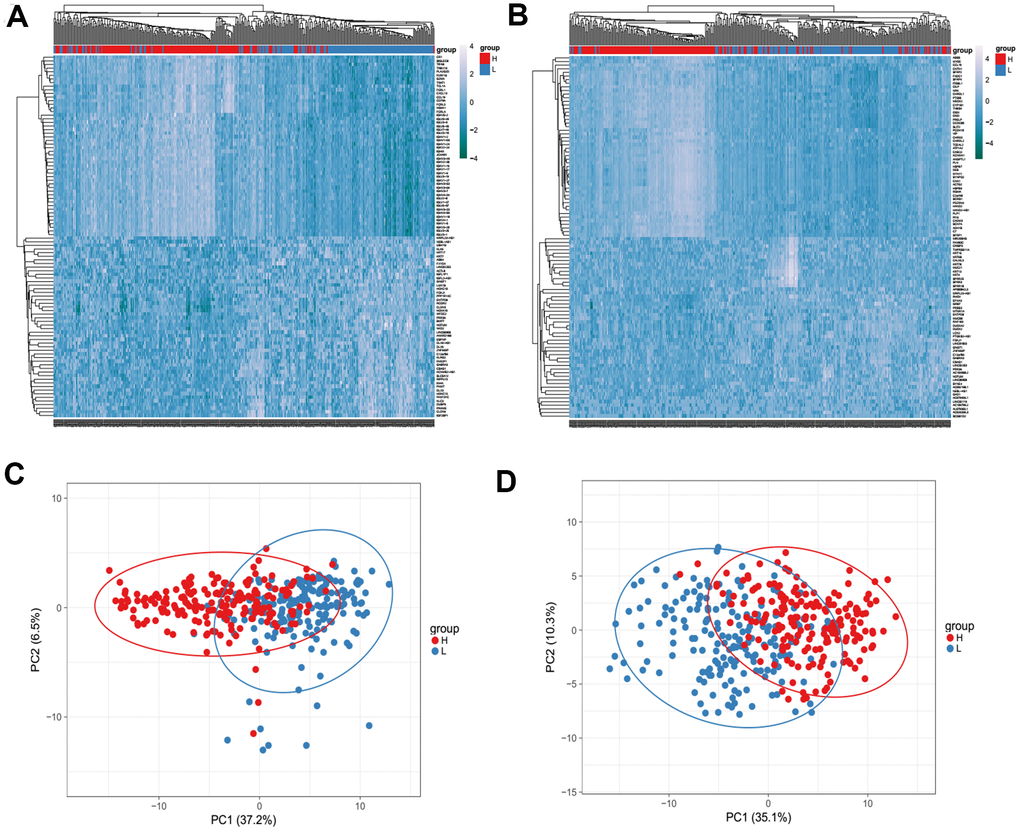
Figure 3.Heatmaps (A, B) and Principal Component Analysis (PCA) (C, D) showed different gene expression profiles in the immune scores of top half (high score) vs. bottom half (low score). P <0.05, fold change >1.5. Genes with higher expression are shown in red, lower expression are shown in blue.