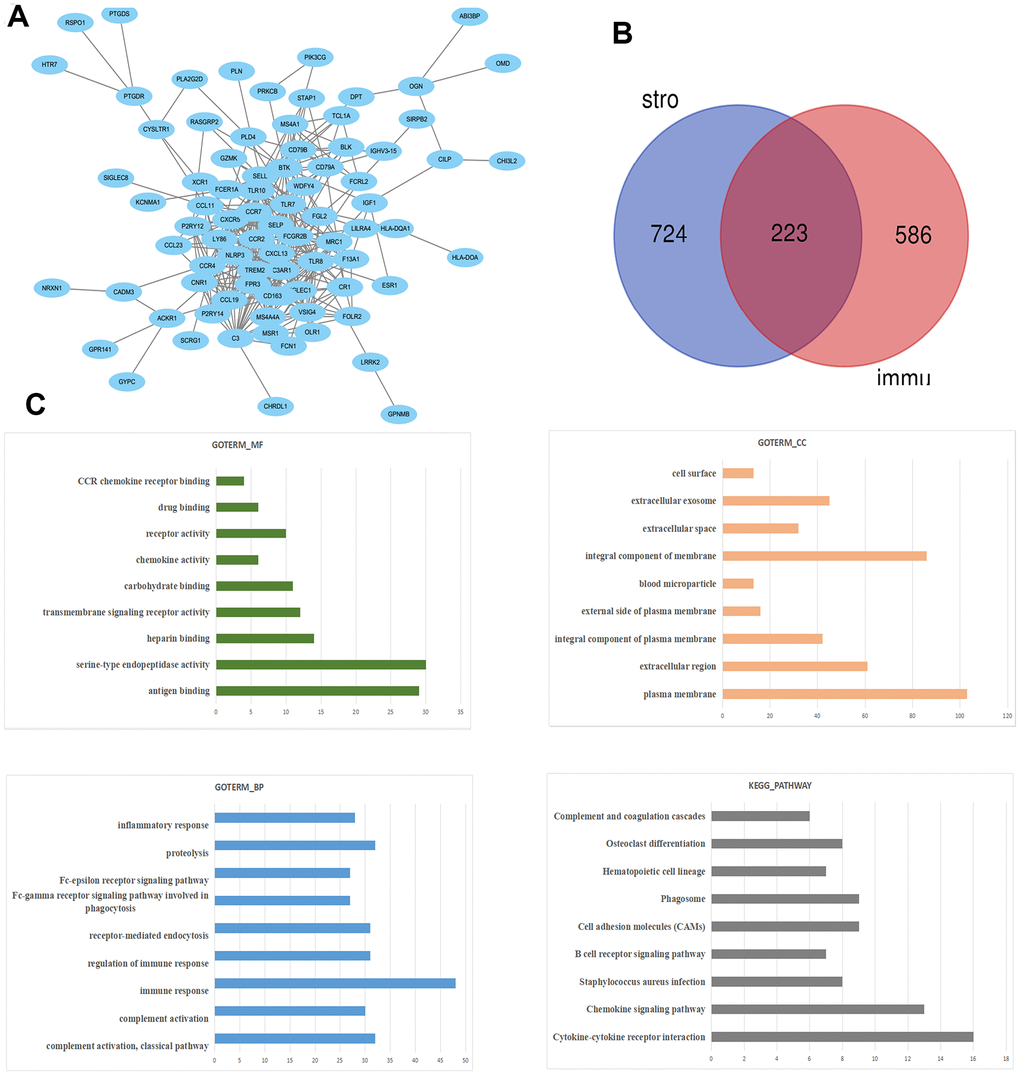
Figure 4.The PPI network of DEGs was constructed using Cytoscape. (A) Venn diagram was generated on the stromal scores and immunes scores of DEGs via Draw Venn Diagram (B). The biological process analysis of hub genes was constructed using BiNGO. The color depth of nodes refers to the corrected P-value of ontologies. The size of nodes refers to the numbers of genes that are involved in the ontologies. P<0.05 was considered statistically significant. The KEGG pathway and GO enrichment analysis of DEGs (C).