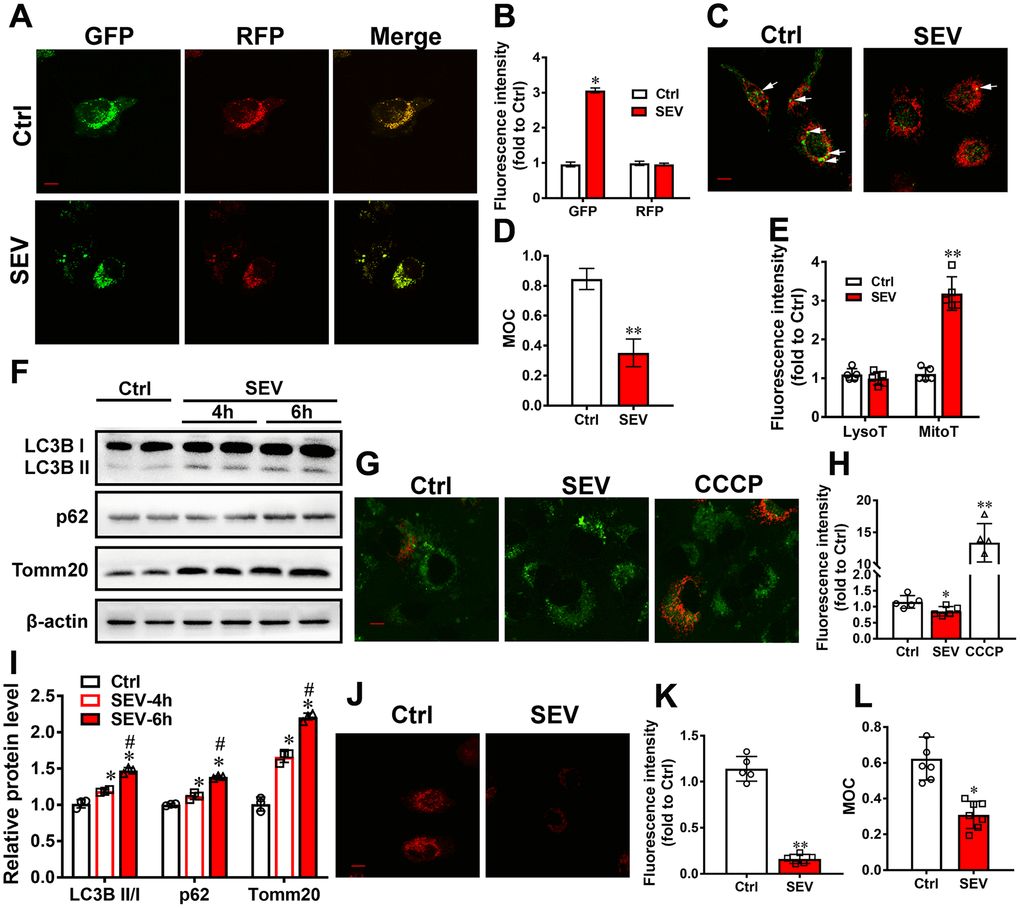
Figure 3.Sevoflurane induced mitophagy dysfunction in vitro. H4 cells were treated for 6 h with 4.1% sevoflurane 24 h after being transfected with AdM-CMV-mCherry-EGFP-LC3B adenoviruses. Fluorescent images were captured by confocal microscopy (A). The results of fluorescent analysis (B) and Manders’ overlap coefficient (D) are shown. H4 cells were treated with 4.1% sevoflurane for 6 h (SEV), and mitochondria and lysosomes were visualized using MitoTracker Red and LysoTracker Green (C). The results of fluorescent analysis (E) and Manders’ overlap coefficient (L) are shown. The LysoT referred to the fluorescent intensity of LysoTracker Green and the MitoT referred to the fluorescent intensity of MitoTracker Red. Primary cultured neurons were subjected to 4.1% sevoflurane for 4 h (SEV-4h) and 6 h (SEV-6h). The LC3B, p62 and Tomm20 protein levels were determined by western blotting analysis (F). The results of semi-quantitative analysis of LC3B, p62, Tomm20 and β-actin are shown in (I). H4 cells were treated for 6 h with 4.1% sevoflurane and CCCP (50 μM) for 30 min 24 h after being transfected with mt-Keima reporters. Fluorescent images were captured by confocal microscopy (G). The results of fluorescent analysis are shown in (H). H4 cells were treated with 4.1% sevoflurane for 6 h (SEV), and then treated with DQ-BSA at a final concentration of 10 μg/mL for 30 min. Intracellular fluorescent signals were analyzed by confocal fluorescence microscopy (J). The results of fluorescent analysis of DQ-BSA are shown in (K). Images show representative examples from three independent experiments for each group. Scale bar represents 10 μm. The data are expressed as mean ± SD. (B, D, E, K, L) *P<0.05, **P<0.01 Ctrl vs SEV. (I) *P<0.05, Ctrl vs SEV-4h and SEV-6h; # P<0.05, SEV-4h vs SEV-6h. (H) * P<0.05, Ctrl vs SEV; ** P<0.01, Ctr vs CCCP.