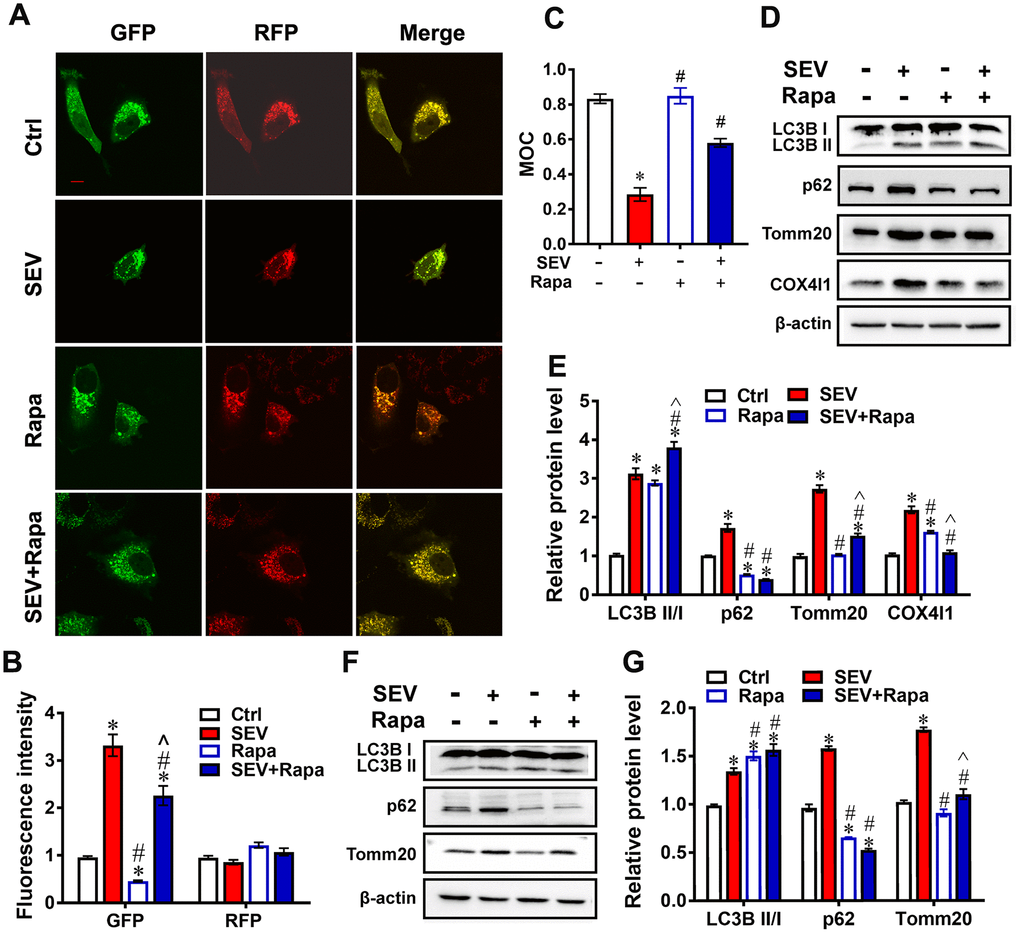
Figure 6.Rapamycin reversed sevoflurane-induced mitophagy dysfunction. H4 cells were treated for 6 h with 0% sevoflurane with rapamycin (1μmol/L) (Rapa), 4.1% sevoflurane without rapamycin (SEV), 4.1% sevoflurane with rapamycin (SEV+Rapa), or 0% sevoflurane without rapamycin (Ctrl) 24 h after being transfected with AdM-CMV-mCherry-EGFP-LC3B adenoviruses. Fluorescent images were captured by confocal microscopy (A). Images show representative examples from three independent experiments for each group. The results of fluorescent analysis are shown in (B). The Manders’ overlap coefficient is shown in (C) Primary cultured neurons were subjected to 0% with rapamycin (1 μmol/L) (Rapa), 4.1% sevoflurane without rapamycin (SEV), 4.1% sevoflurane with rapamycin (SEV+Rapa), or 0% sevoflurane without rapamycin (Ctrl) for 6 h. The LC3B, p62, Tomm20 and COX4l1 protein levels were determined by western blotting analysis (D). Results of semi-quantitative analysis of LC3B, p62, Tomm20 and COX4l1 are shown in (E). Eighteen-month-old rats were subjected to 2% sevoflurane for 5 h (SEV and SEV+Rapa groups). Rapamycin (20 mg/kg/d) was administrated intraperitoneally two days before sevoflurane treatment, and daily administrations were continued for one week (Rapa and SEV+Rapa groups). After perfusion, the LC3B, p62 and Tomm20 protein levels were determined by western blotting analysis (F). Results of semi-quantitative analysis of LC3B, p62 and Tomm20 are shown in (G). The data are expressed as mean ± SD. *P<0.05, Ctrl vs SEV, Rapa, and SEV+Rapa; # P<0.05, SEV vs Rapa and SEV+Rapa; ^ P<0.05, Rapa vs SEV+Rapa.