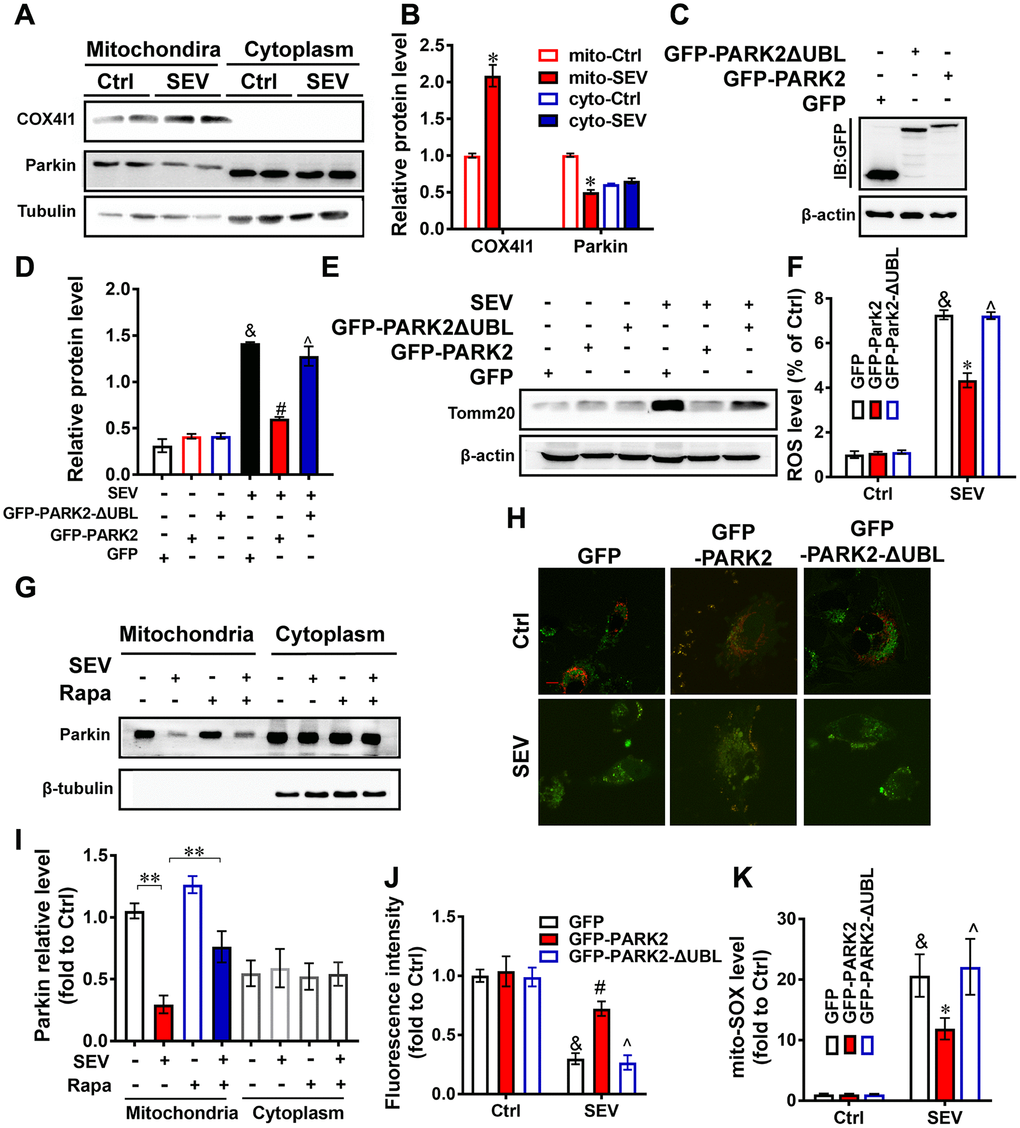
Figure 8.PARK2 is involved in neuroprotection mediated by mitophagy Eighteen-month-old rats were subjected to 2% sevoflurane for 5 h. The COX4l1 and Parkin protein levels in both the cytoplasm and mitochondria were detected by western blotting assay (A). The mito-Ctrl group and mito-SEV group referred to the mitochondria protein of hippocampus from aged rats with untreated or treated with sevoflurane. The cyto-Ctrl group and cyto-SEV group referred to the cytoplasmic protein of hippocampus from aged rats with untreated or treated with sevoflurane. The results of semi-quantitative analysis of COX4l1, Parkin and Tubulin are shown in (B). H4 cells were transfected with plasmids encoding pEGFP, PEGF-PARK2 or pEGF-PARK2ΔUBL following treatment of cells with 4.1% sevoflurane for 6 h. The levels of proteins after transfection were determined by western blotting against GFP (C). The Tomm20 level in the indicated groups were examined by western blotting (E). The results of semi-quantitative analysis of Tomm20 and β-actin are shown in (D). The ROS level (F) and mitochondrial ROS level (K) of each group were measured. Eighteen-month-old rats were subjected to 2% sevoflurane for 5 h. Rapamycin (20 mg/kg/d) was administrated intraperitoneally two days before sevoflurane treatment, and daily administrations were continued for one week. The levels of Parkin in both the cytoplasm and mitochondria were detected by western blotting assay (G). The results of semi-quantitative analysis of Parkin and Tubulin are shown in (I). H4 cells were transfected with plasmids encoding pEGFP, pEGFP-PARK2 or pEGFP-PARK2ΔUBL and a mt-Keima reporter following treatment of cells with 4.1% sevoflurane for 6 h. Intracellular fluorescent signals were analyzed by confocal fluorescence microscopy (H). The results of fluorescent analysis are shown in (J). Images show representative examples from three independent experiments for each group. Scale bar represents 10 μm. The data are expressed as mean ± SD. (B) *P<0.05, mito-Ctrl vs mito-Sev, (D, F, J, K) &P<0.05, GFP-Ctrl vs GFP-SEV; #P<0.05 GFP-SEV vs GFP-PARK2-SEV; ^P<0.05 GFP-PARK2-SEV vs GFP-PARK2ΔUBL-SEV. (I) **P<0.01.