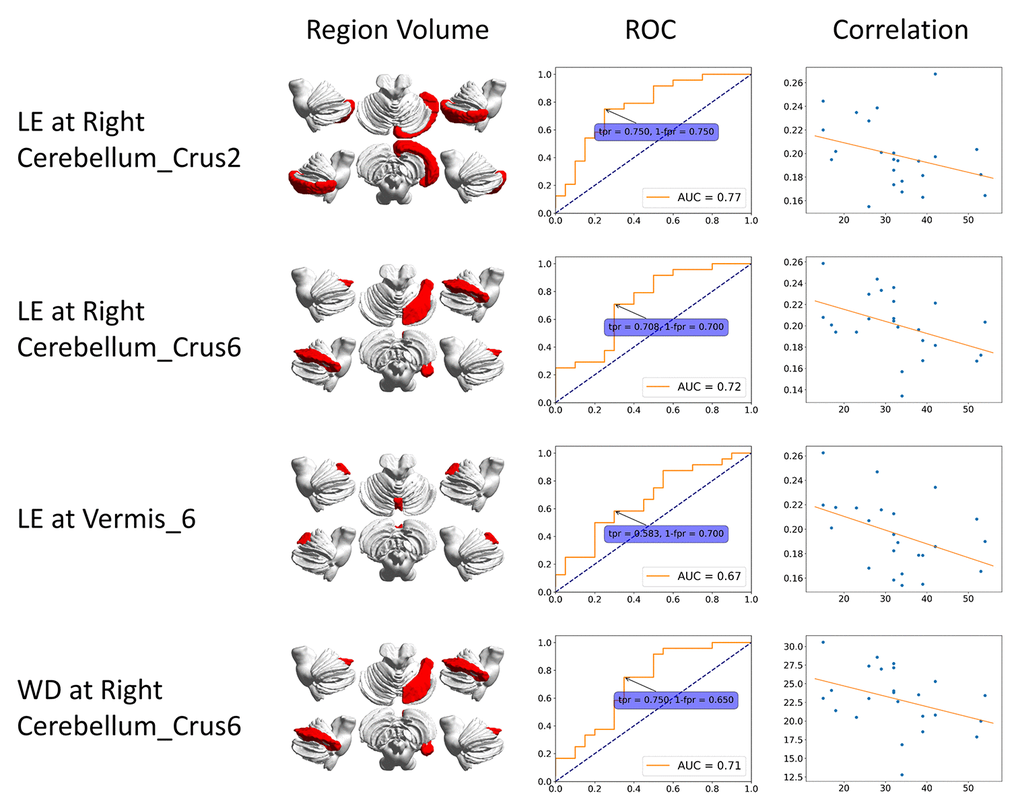
Figure 1.ROC curve and correlation of static features. The correlation is between clinical score (x-axis) and features (y-axis). BC: betweenness centrality; CCFS: clustering coefficient; LE: local efficiency; WD: weighted degree.
Figure 1 — Abnormal static and dynamic functional connectivity of resting-state fMRI in multiple system atrophy | Aging