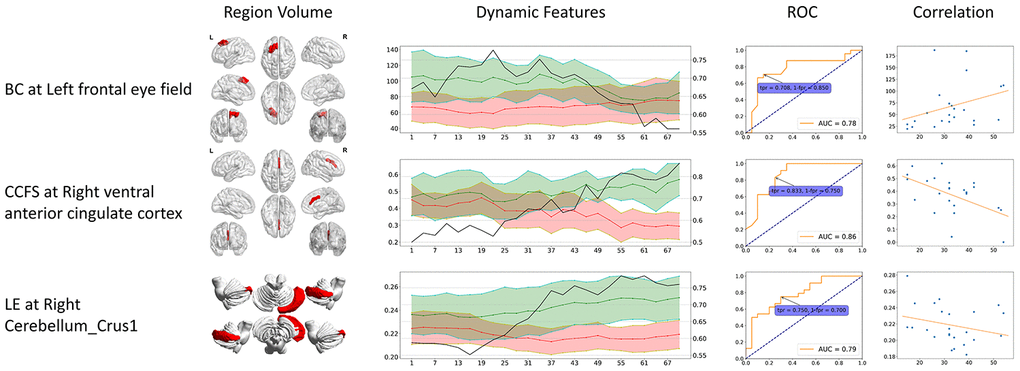
Figure 4.Dynamic specific significant features. These significant features can only be identified from dynamic functional connectivity. The 3D region volume was shown, as well as the dynamic features line plots. Green stands for healthy controls, red stands for CMSA patients (value on the left axis), and black line stands for ROC AUC (value on the right axis). The ROC curve at the time point when AUC reached its maximum is shown. The correlation is between clinical score (x-axis) and features (y-axis). BC: betweenness centrality; CCFS: clustering coefficient; LE: local efficiency; WD: weighted degree.