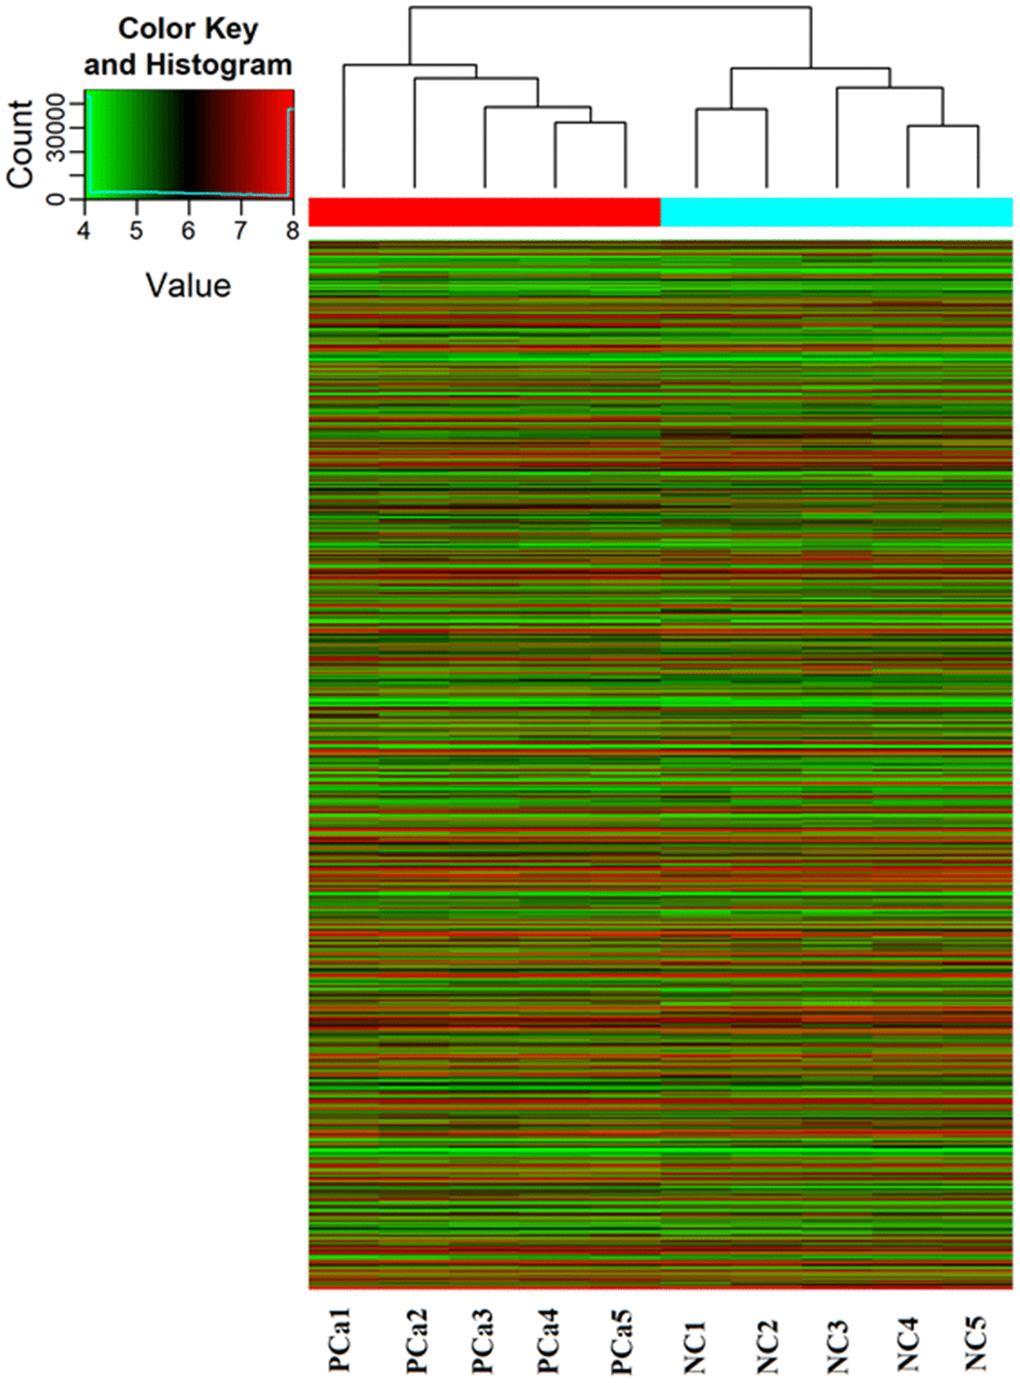
Figure 1.PiRNA expression profiling in Arraystar piRNA Microarray. The Hierarchical Clustering shows a distinguishable piRNA expression profiling among samples. “Red line” indicates high expression, and “Green line” indicates low expression. Five PCa tissues (experimental) and five corresponding normal tissue (NC) were used to perform the piRNA microarray in triplicate.