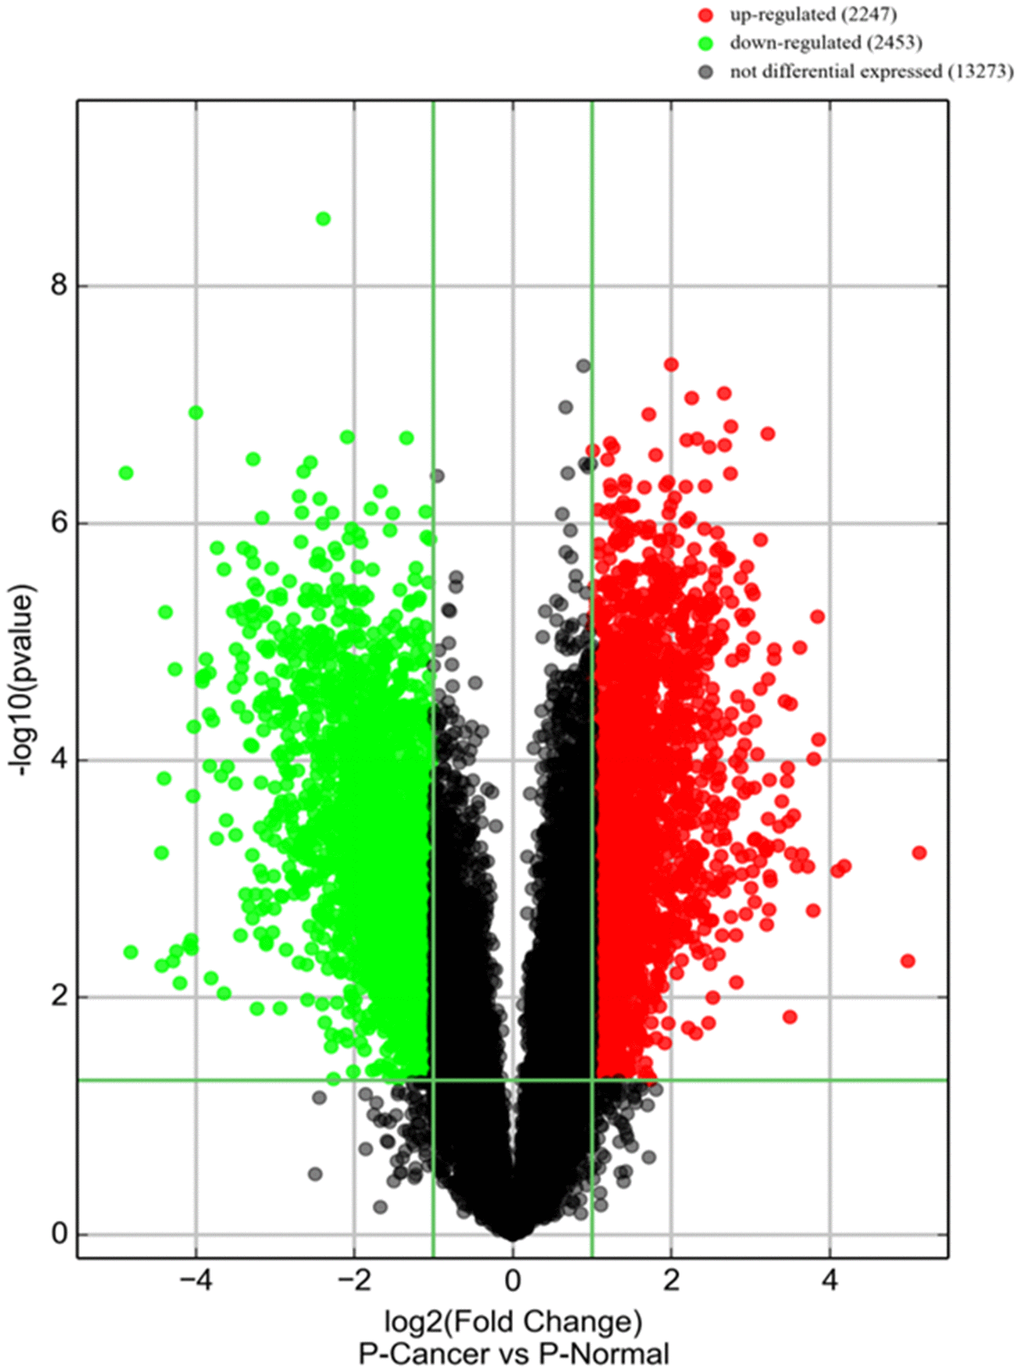
Figure 2.piRNA expression in PCa tissues. Volcano plot shows piRNA differential expression in PCa tissues and controls using fold-change values and P-values. The horizontal green line represents a P-value of 0.05, and the vertical green lines correspond to 2.0-fold up and down, respectively. “Red points” indicates high relative expression and “Green points” indicates relative low expression with statistical significance (P<0.05).