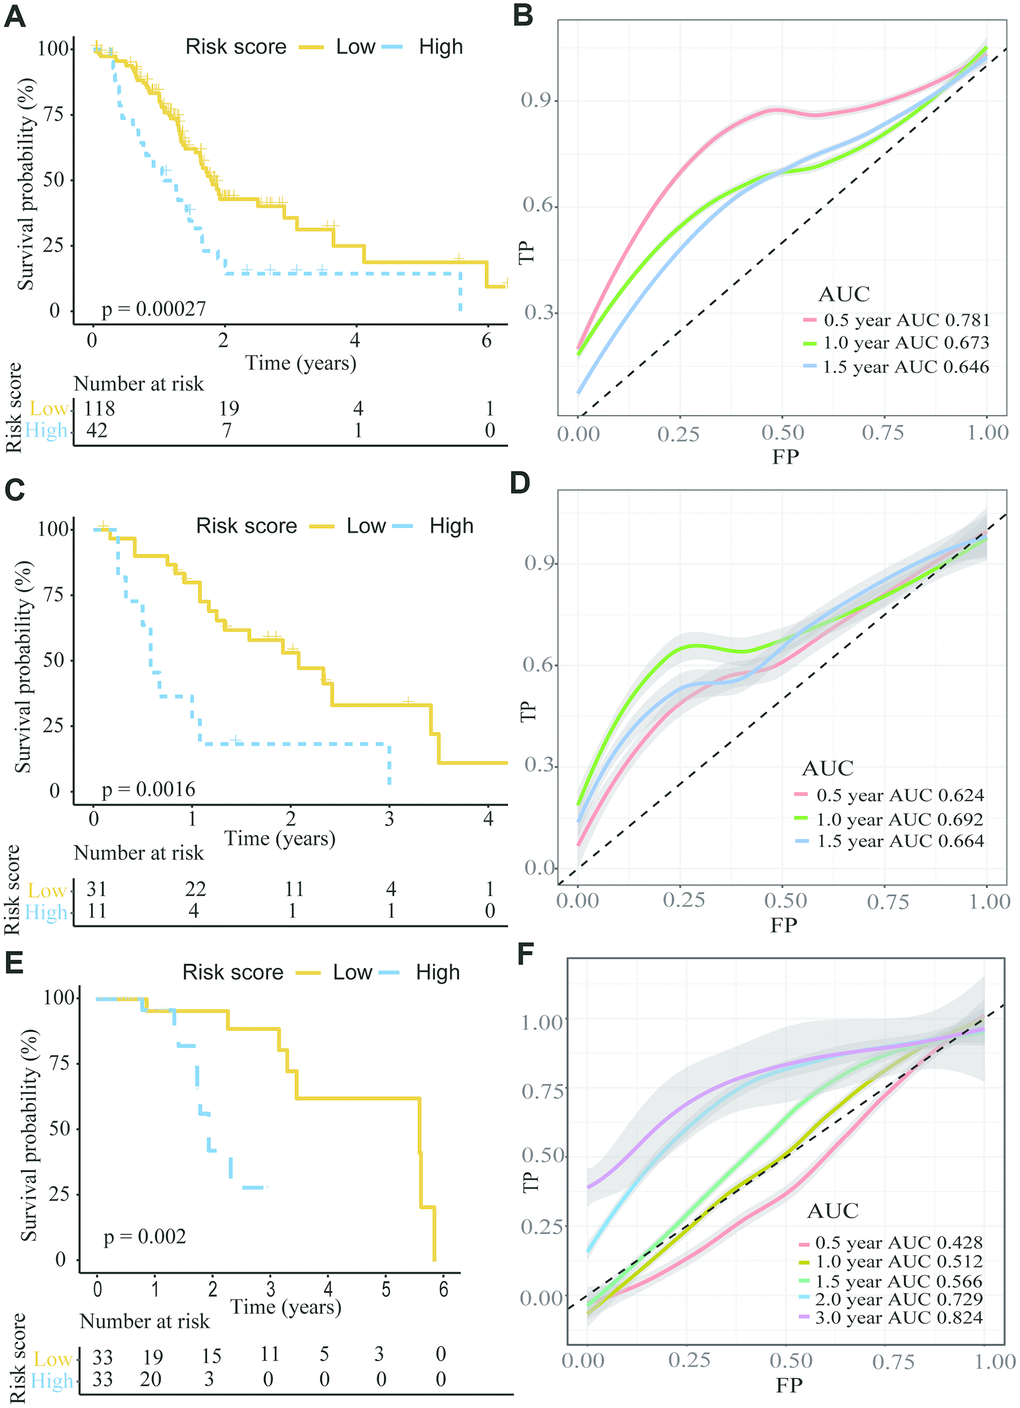
Figure 5.The K-M plot showed a lower overall survival in the high risk group compared to the low risk group divided by the optimal cut-off point. (A, B) K-M and time-dependent ROC curves for the prognostic model based on ANLN and HIST1H1C expression in the TCGA PC cohort. (C, D) K-M and time-dependent ROC curves for the prognostic model based on ANLN and HIST1H1C expression in the GSE28735. (E, F) K-M and time-dependent ROC curves for the prognostic model based on ANLN and HIST1H1C expression in the GSE62452.