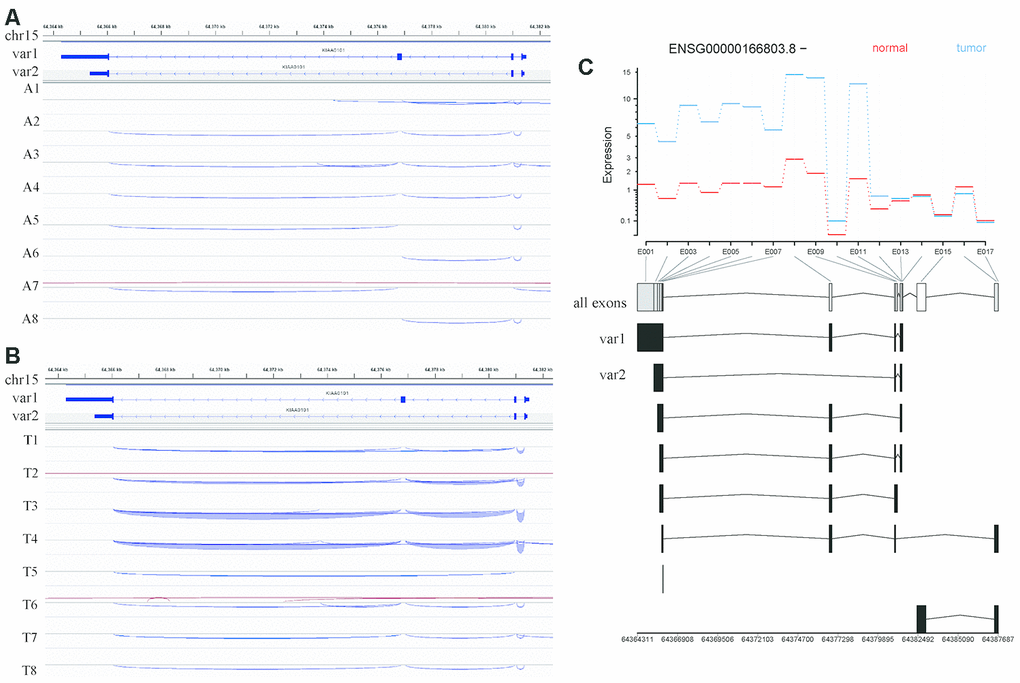
Figure 6.Analysis of KIAA0101 transcripts variant 1 and variant 2 based on RNA sequencing of our HCC specimens. (A) IGV visualization of splicing events in the genomic region covering the KIAA0101 transcript variants 1 and 2 in adjacent tissues. The top coordinate presents the location in the reference genome (GRch38), which ranges from 64,364 kb to 64,382 kb on chromosome 15. The exon usage of KIAA0101 transcripts variant1 and variant 2 is demonstrated below this coordinate. The splicing events in adjacent tissues A1-A8 are plotted and represented by curves that link the exons. The blue curve indicates splicing events on the minus strand, and the red curve indicates splicing events on the plus strand. (B) IGV visualization of splicing events in the genomic region covering the KIAA0101 transcript variants 1 and 2 in HCC tissues. The splicing events in HCC tissues T1-T8 are plotted. (C) Differential analysis of KIAA0101 (ENSG00000166803.8, - strand) exon usage in HCC and adjacent tissues. The red line indicates the average expression of different exons in the 8 normal tissue samples, and the blue line indicates those in the 8 tumor tissue samples. The horizontal axis demonstrates the position of all the exons from E001 to E017. The usage of these exons by different KIAA0101 transcripts is plotted below the horizontal axis, among which are variant 1 and variant 2. The bottom coordinate presents the corresponding reference genome coordinate.