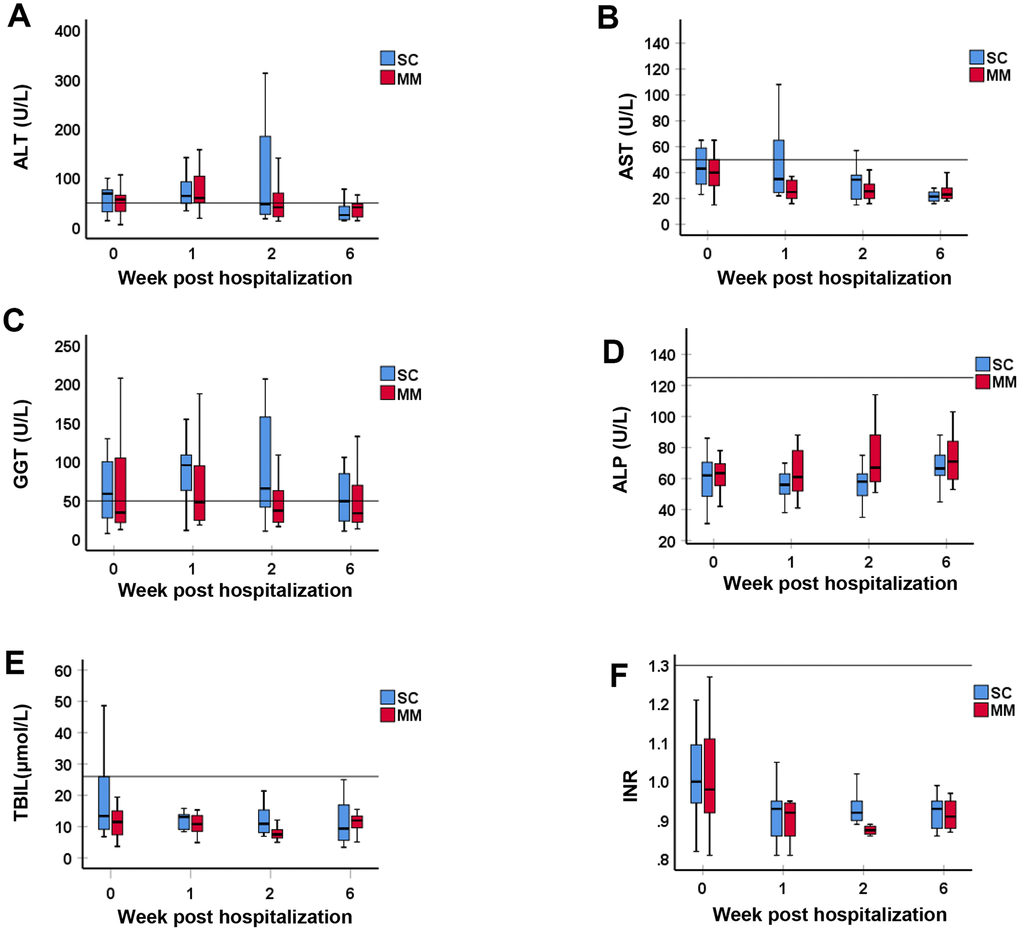
Figure 1.Comparison of liver function test between MM and SC patient groups with liver function test abnormality. The liver function tests including (A) ALT, (B) AST, (C) GGT, (D) ALP, (E) TBIL, and (F) INR, were compared between MM and SC patient groups with liver function test abnormality at Week 0, 1, 2 and 6 post hospitalization for COVID-19. Values are expressed as median (interquartile range (IQR), 25-75%). The horizontal line in each panel is the upper limit of normal (ULN) for each parameter. There was no statistically significant difference in any of the LFT or INR parameters between SC and MM patients.