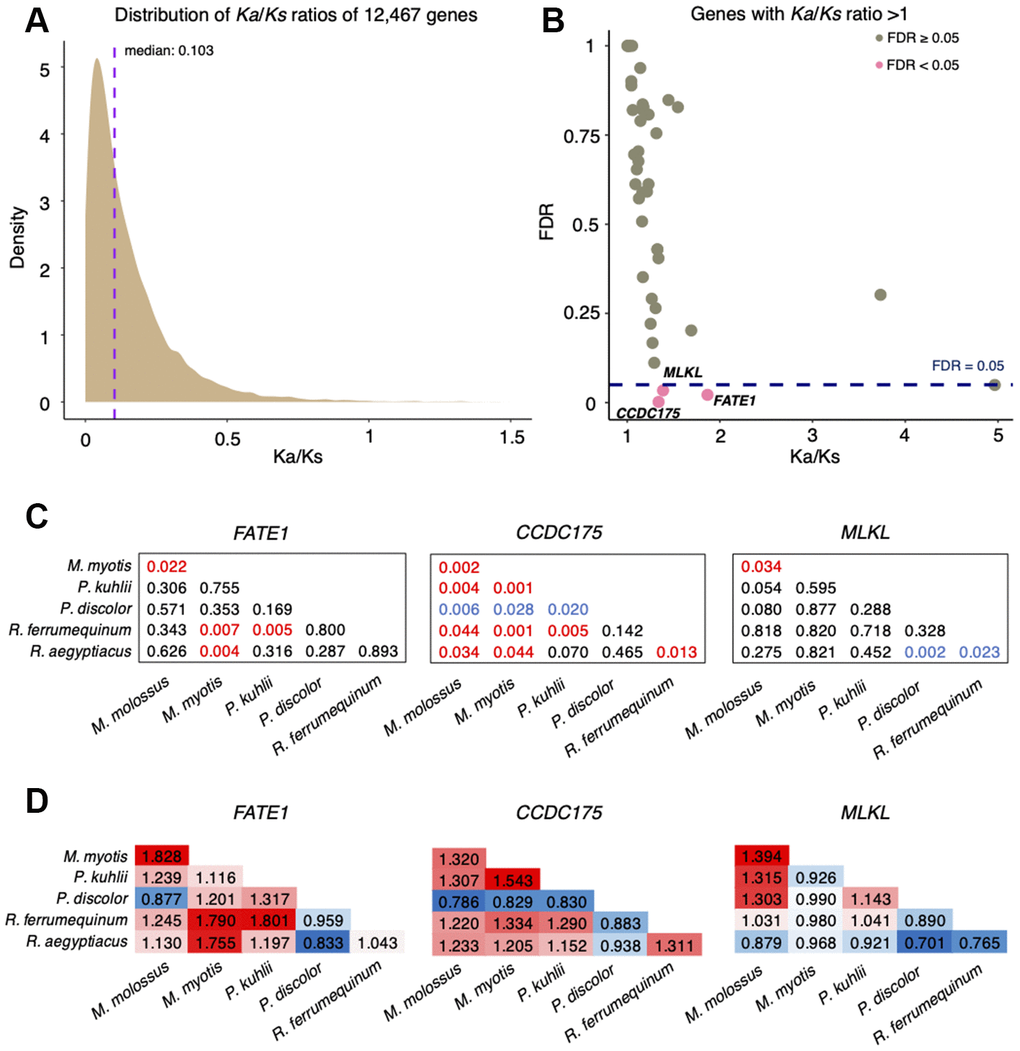
Figure 1.Analysis of Ka/Ks substitution rates of 12,467 single-copy genes between M. myotis and M. molossus. (A) Distribution of Ka/Ks ratios of 12,467 single-copy genes. To better visualize the distribution, six genes with Ka/Ks > 1.5 were not included in this plot. (B) Genes with Ka/Ks > 1. Three genes highlighted in red show significant positive selection (Ka/Ks > 1; FDR < 0.05 Fisher’s exact test). (C) Significance (FDR) of Ka/Ks ratios of FATE1, CCDC175 and MLKL between 6 bat species through pairwise comparisons. The red values indicate significant positive selection while the blue values indicate significant purifying selection. The black values indicate no selection. (D) Ka/Ks ratios of FATE1, CCDC175 and MLKL between 6 bat species through pairwise comparisons. The red values indicate Ka/Ks ratios > 1 while the blue values indicate Ka/Ks ratios < 1.