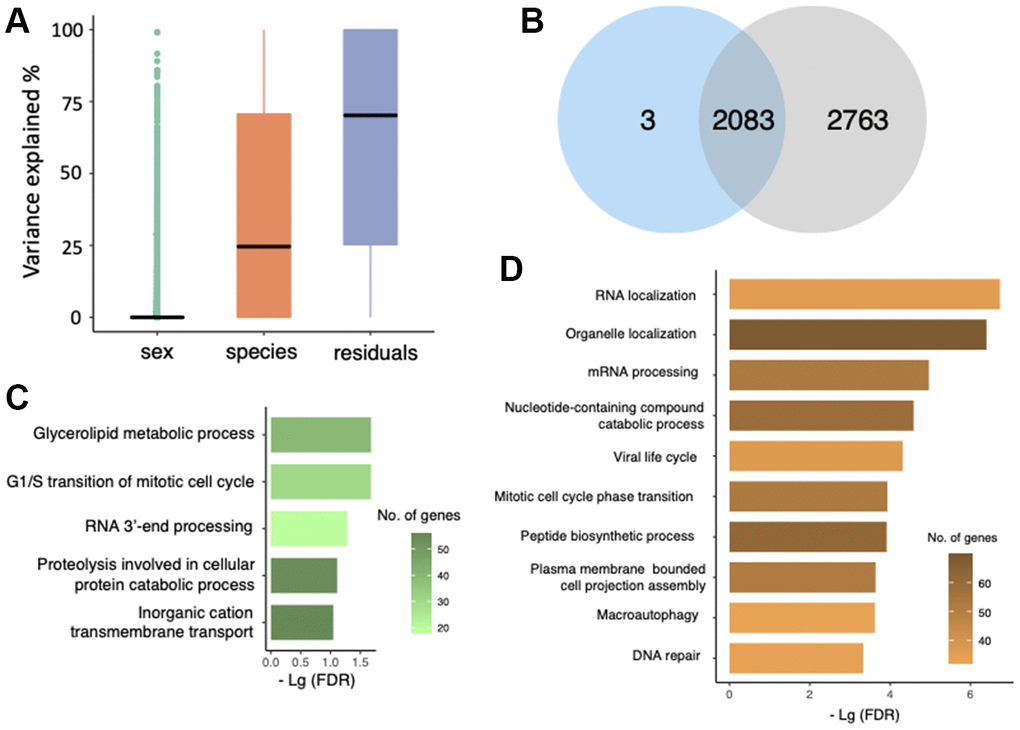
Figure 3.Gene expression variation analysis. (A) Evaluation of gene expression variance using a linear mixed model. Residual variance represents the contribution from uncharacterized variables. (B) Overlap of differentially expressed genes (blue) and the genes with at least 80% of expression variation resulted from ‘species’ (grey). (C) GO terms that were enriched by 1,060 genes that had higher expression in M. molossus. (D) GO terms that were enriched by 1,026 genes that had higher expression in M. myotis.