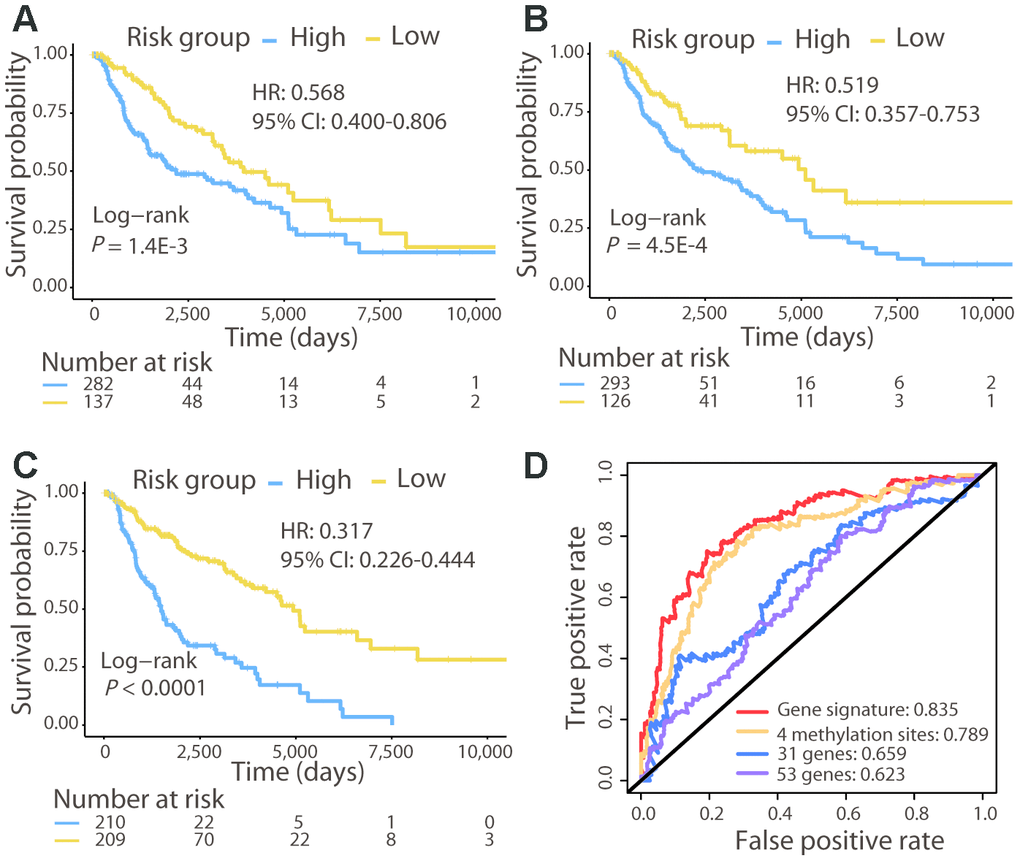
Figure 2.Comparison of the 21-gene signature with known biomarkers in predicting the OS in the TCGA cohort. Kaplan–Meier analysis was performed for patients classified by the 31-gene (A), 53-gene (B), and methylation (C) signatures. (D) ROC curves of the three known signatures and the 21-gene signature are shown. The AUC values of each signature demonstrate their ability to predict the patient OS.