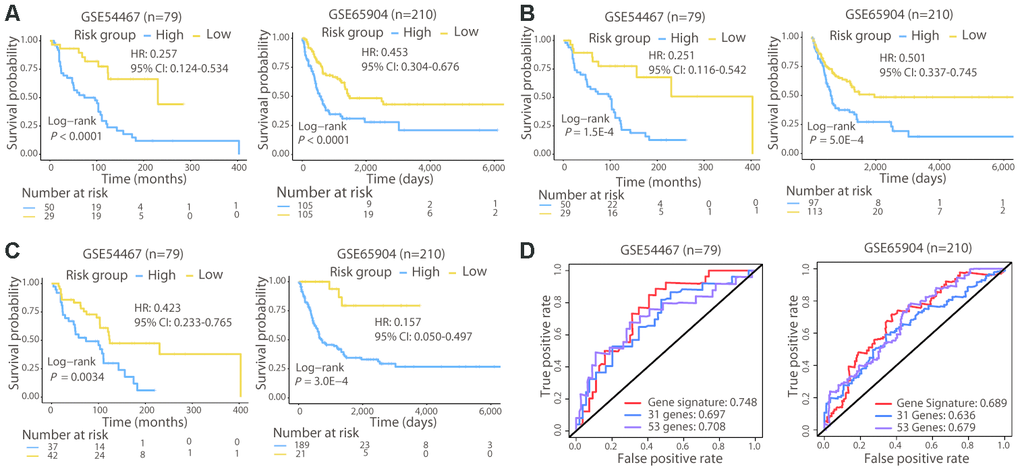
Figure 3.Survival and ROC curves of the different signatures in the validation cohorts. Survival analysis of patients classified by the 21-gene (A), 31-gene (B), and 53-gene (C) signatures in the two validation cohorts. (D) ROC curves and AUC values of the three signatures in the two validation cohorts. In GSE65904, the AUC value for 3-year OS was calculated, since few patients lived for 5 years.