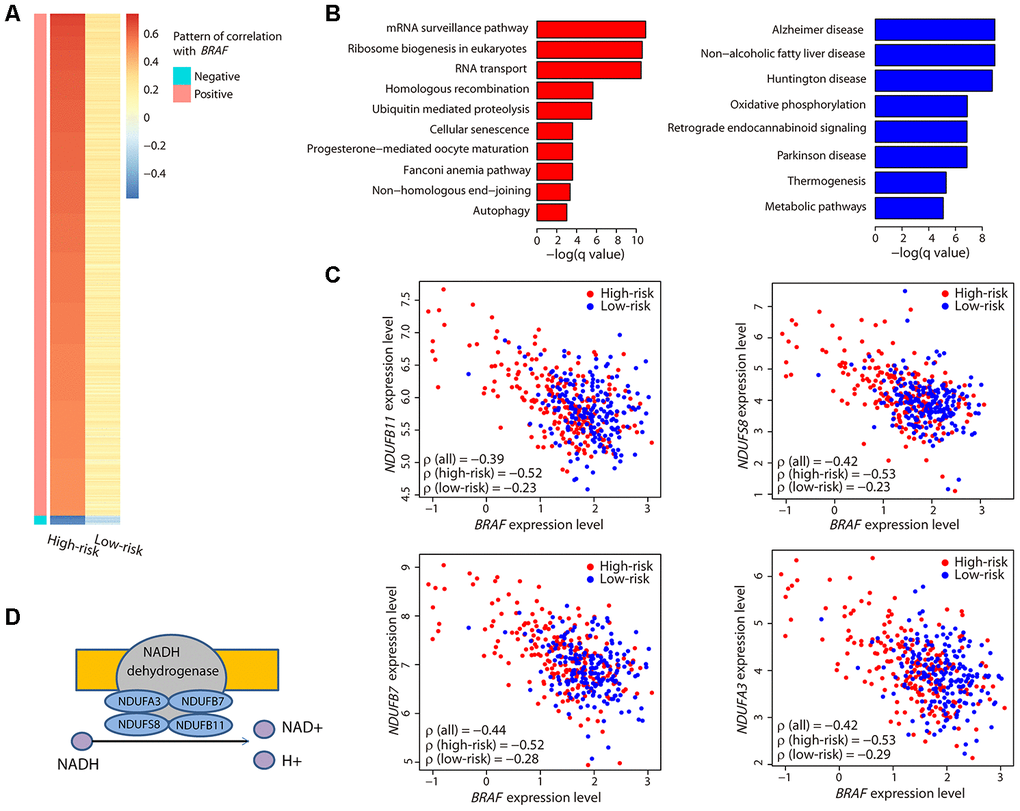
Figure 5.Characterization of the BRAF-correlated genes. (A) The heatmap illustrates all ρ values of genes that had a strong correlation with BRAF. Only two sets of genes exhibiting a strong positive or negative correlation in the high-risk group and a weak correlation in the low-risk group were obtained. (B) Bar plots showing the significantly (adjusted P value < 0.05) enriched KEGG pathways related to the positively (red) and negatively (blue) correlated genes. (C) Correlation between the expression levels of the four genes encoding the subunits of NADH dehydrogenase and BRAF. Coefficient values between two genes among all patients, high-risk patients, and low-risk patients are shown. (D) Illustration showing the four genes encoding the subunits of NADH dehydrogenase and their function.