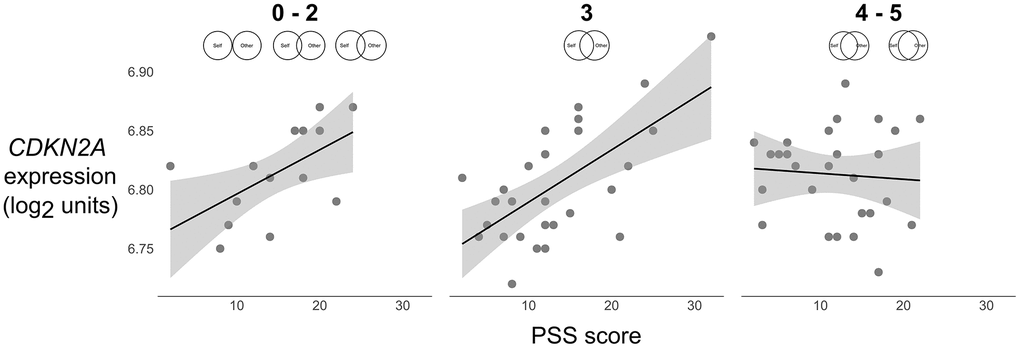
Figure 1.Scatterplots of the association between perceived stress (PSS) and expression of the p16INK4a-encoding gene CDKN2A (log2 units) at low (0–2), average (3), and high (4–5) levels of relationship closeness (scale item responses depicted above each plot). Solid lines were plotted using parameter estimates from the unadjusted models in Table 2. Grey shaded bands reflect the 95% CI for the best fit regression line computed from the raw data.