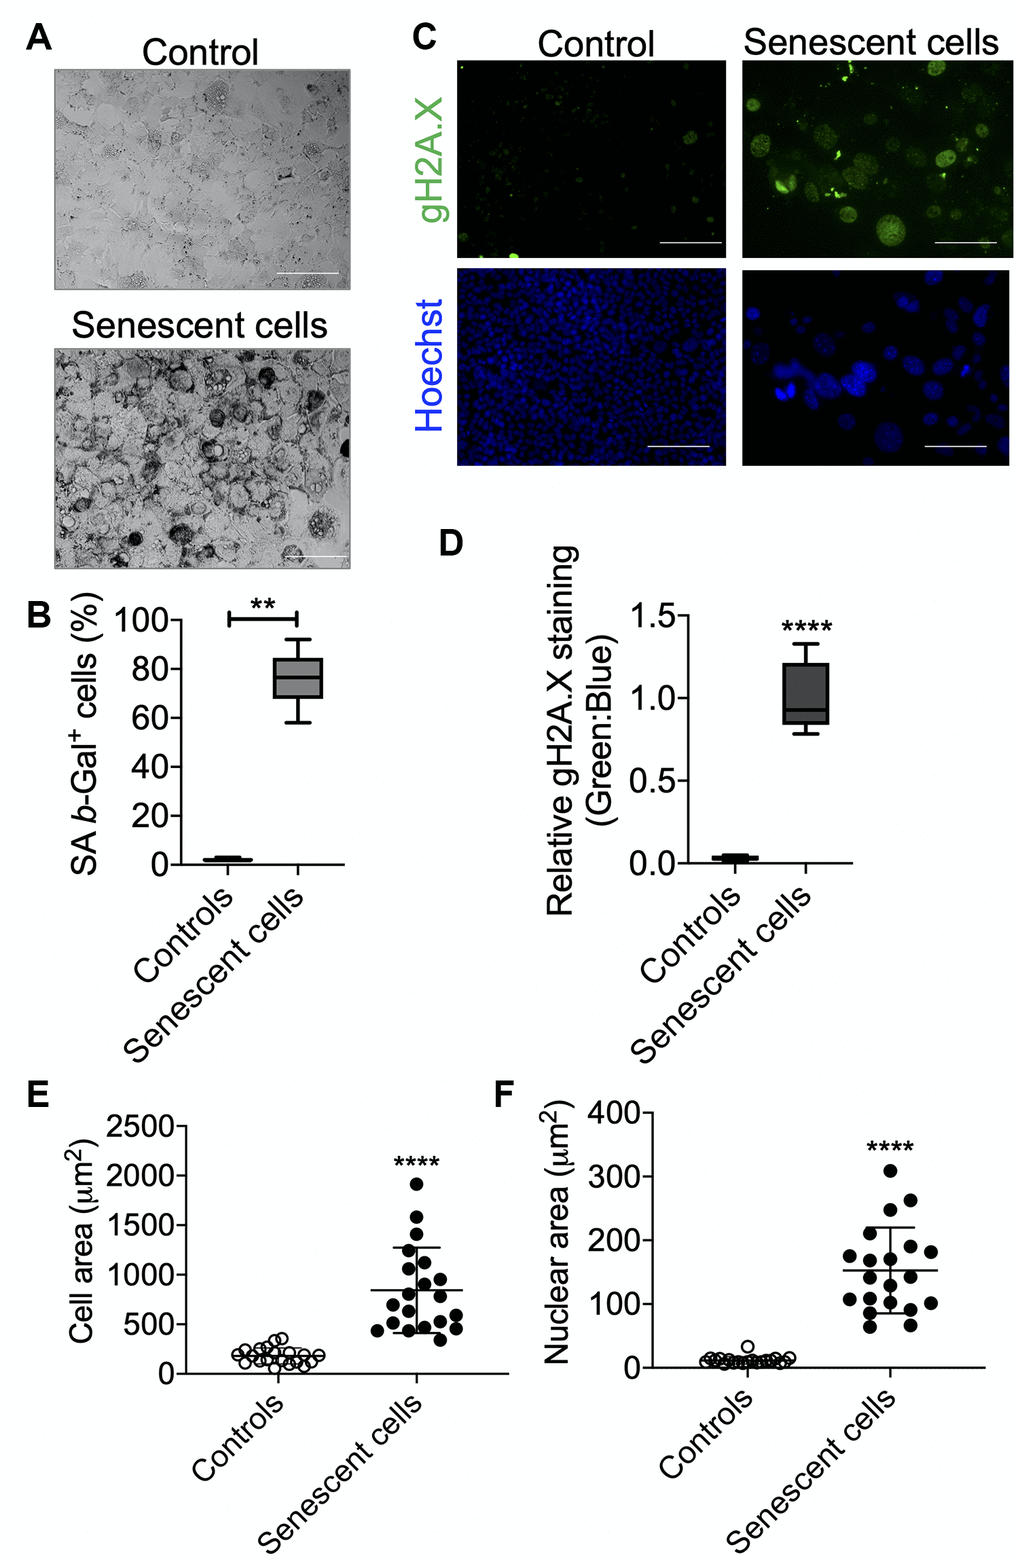
Figure 2.Senescence validation by SA β-Gal and γH2A.X staining. After senescence induction at day 7, cells were re-seeded in 4-chambered slides and next day SA β-Gal (A) and γH2A.X (B) staining were performed. Cells were counted manually for analyzing SA β-Gal+ cells over total cells and presented as percent positive cells. Scale bars as 50 μm. (C) Cells were counter-stained with Hoechst 33324 for immunofluorescence imaging and relative γH2A.X signals were analyzed over Hoechst 33324 signals. Scale bars as 100 μm. (D). (E and F). Area of the cells (E) and nucleus (F) were measured using ImageJ (NIH) software. Statistical differences were calculated significant as *p<0.05 and **p<0.001.