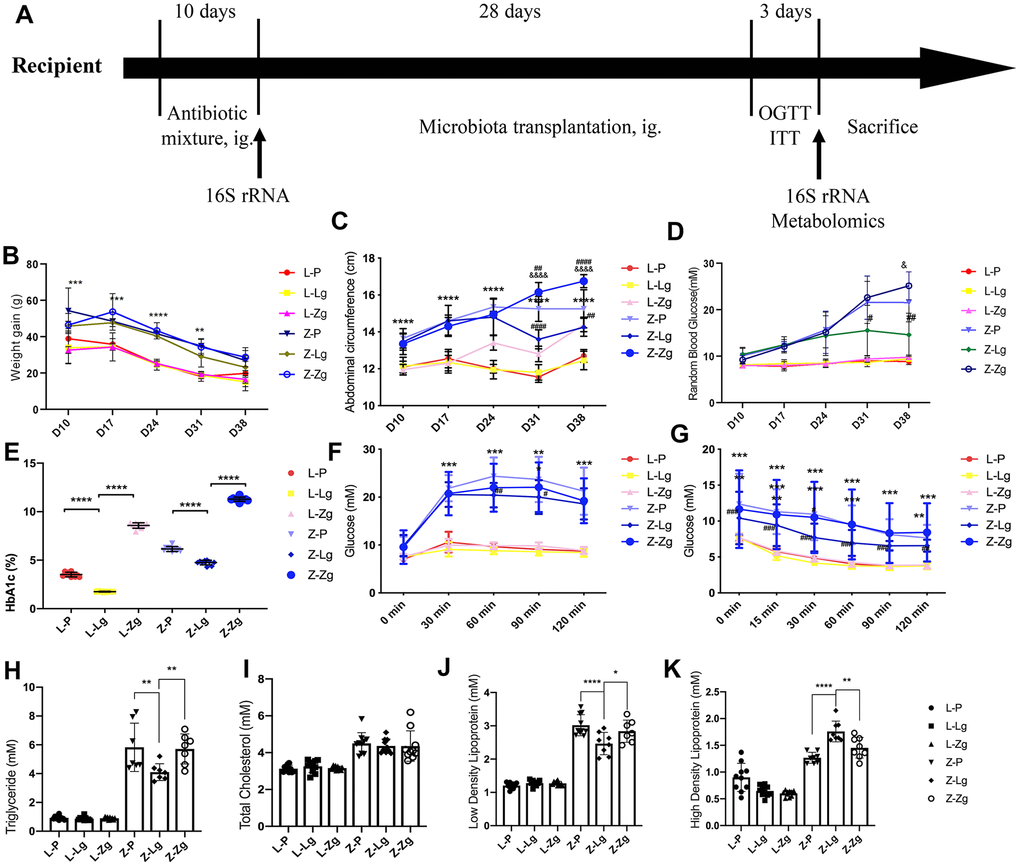
Figure 1.Changes in glycolipid metabolism phenotypes in recipient rats before and after transplantation. (A) Detailed information. LZ rats were fed a normal diet, and ZDF rats were fed an induced diet #5008. After adaptive feeding, the four groups were given an antibiotic mixture for 10 days, and then the corresponding supernatant from the LZ group and ZDF group was given to LZ and ZDF recipient rats, whereas the control group was given PBS. The course of T2DM was judged by OGTT, ITT, RBG, and FSI. After antibiotic administration and FMT, feces were collected for 16S rRNA sequencing and metabolomic analysis of intestinal contents at the end of the experiment; (B) Weight gain at different stages (g; Time: F3, 115 = 90.60, P < 0.0001; Group: F4, 45 = 110.2, P < 0.0001; Interaction: F20, 190 = 1.844, P < 0.05; n = 7-10); (C) Abdominal circumference at different stages (cm; Time: F5, 270 = 318.0, P < 0.0001; Group: F4, 270 = 67.39, P < 0.0001; Interaction: F20, 270 = 16.09, P < 0.0001; n = 10); (D) Random blood glucose at different stages (mM; Time: F2, 90 = 131.3, P < 0.0001; Group: F4, 45 = 55.78, P < 0.0001; Interaction: F20, 214 = 12.67, P < 0.0001; n = 8-10); (E) Glycosylated hemoglobin after FMT (%; F5, 54=2396, P < 0.0001; n = 10); (F) Comparison of OGTT (mM; Time: F4, 216 = 190.3, P < 0.0001; Group: F5, 54 = 55.93, P < 0.0001; Interaction: F20, 216 = 20.59, P < 0.0001; n = 10); (G) Comparison of ITT (mM; Time: F5, 270 = 134.4, P < 0.0001; Group: F5, 54 = 11.58, P < 0.0001; Interaction: F25, 270 = 1.942, P = 0.0056; n = 10); (H) The levels of TG (mM; F5, 45 = 84.27, P < 0.0001); (I) TC (mM; F5, 54 = 20.55, P < 0.0001); (J) LDL-C (mM; F5, 49 = 131.0, P < 0.0001), and (K) HDL-C (mM; F5, 48 = 68.74, P < 0.0001) after FMT (mM, n = 7-10). *P < 0.05, **P < 0.01, and ***P < 0.001 vs. L-P, #P < 0.05, ##P < 0.01, and ###P < 0.001 vs. Z-P, &P < 0.05 vs. Z-Lg in (B–D, F, G). *P < 0.05, **P < 0.01, ***P < 0.001, and ****P < 0.0001 indicated inter-group changes in (E) and (H–K). Statistical analysis was performed with two-way ANOVA in (B–D), one-way ANOVA in (E) and (H–K) and repeated ANOVA in (F, G). The data were expressed as the mean ± SD.