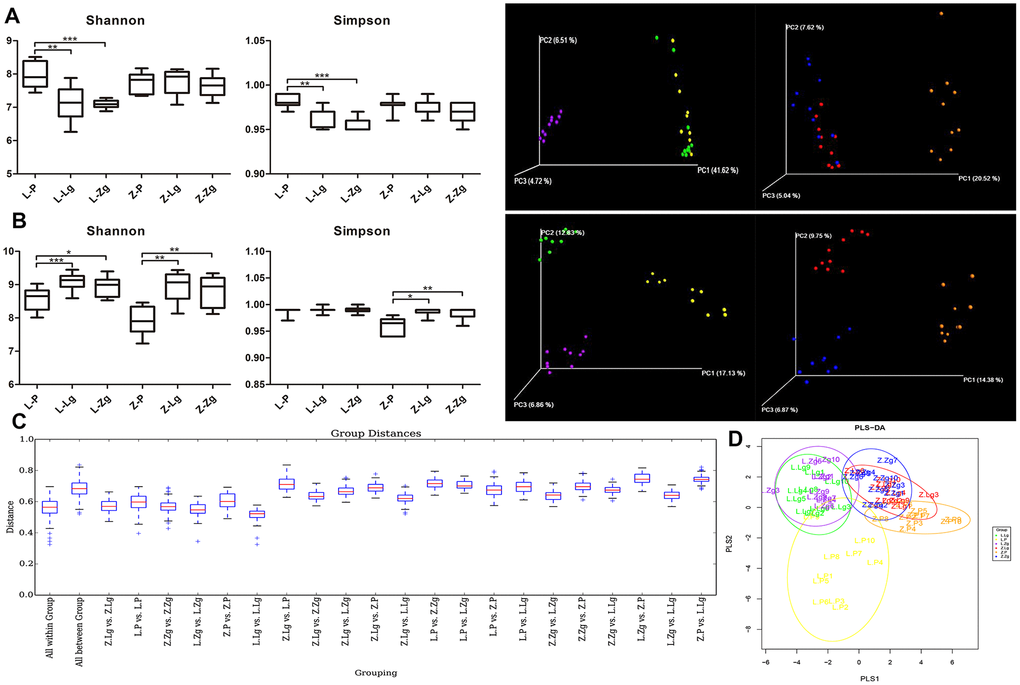
Figure 2.Establishment of the pseudoaseptic rat model and evaluation of intestinal microbiota structure after FMT. (A) Shannon index and Simpson index among six groups after intragastric administration of antibiotics and a three-dimensional sequence plot of unweighted UniFrac PCoA analysis corresponding to LZ and ZDF rats after antibiotics (Shannon: F5, 52 = 10.03, P < 0.0001; Simpson: F5, 50 = 12.94, P < 0.0001; n = 10); (B) Shannon index and Simpson index among six groups after FMT (Shannon: F5, 53 = 13.48, P < 0.0001; Simpson: F5, 53 = 14.69, P < 0.0001; n = 10) and a three-dimensional sequence plot of unweighted UniFrac PCoA analysis corresponding to LZ and ZDF rats after FMT (n = 10). The percentage in parentheses of coordinate axes represented the proportion of differences in the original data that the corresponding principal coordinates could explain. Statistical analysis was performed with one-way ANOVA in (A, B). *P < 0.05, **P < 0.01, and ***P < 0.001. The data were expressed as the mean ± SD; (C) Unweighted UniFrac distance box plots. Horizontal coordinates corresponded to statistical comparisons between groups and within groups, and longitudinal coordinates indicated the corresponding distance values. Borders of boxes represented the interquartile range (IQR), horizontal lines represented the median value, and upper and lower whiskers represented 1.5 outside the upper and lower quartiles. In the IQR range, the symbol “+” denoted potential outliers that exceed the range. Statistical analysis was performed with Student’s t-test and Monte Carlo permutation test; (D) PLS-DA discriminant analysis graph. Each point represented a sample. The same color points belonged to the same grouping, and the same grouping points were marked with ellipses (n = 10). Yellow: L-P; Green: L-Lg; Purple: L-Zg; Orange: Z-P; Red: Z-Lg; Blue: Z-Zg.