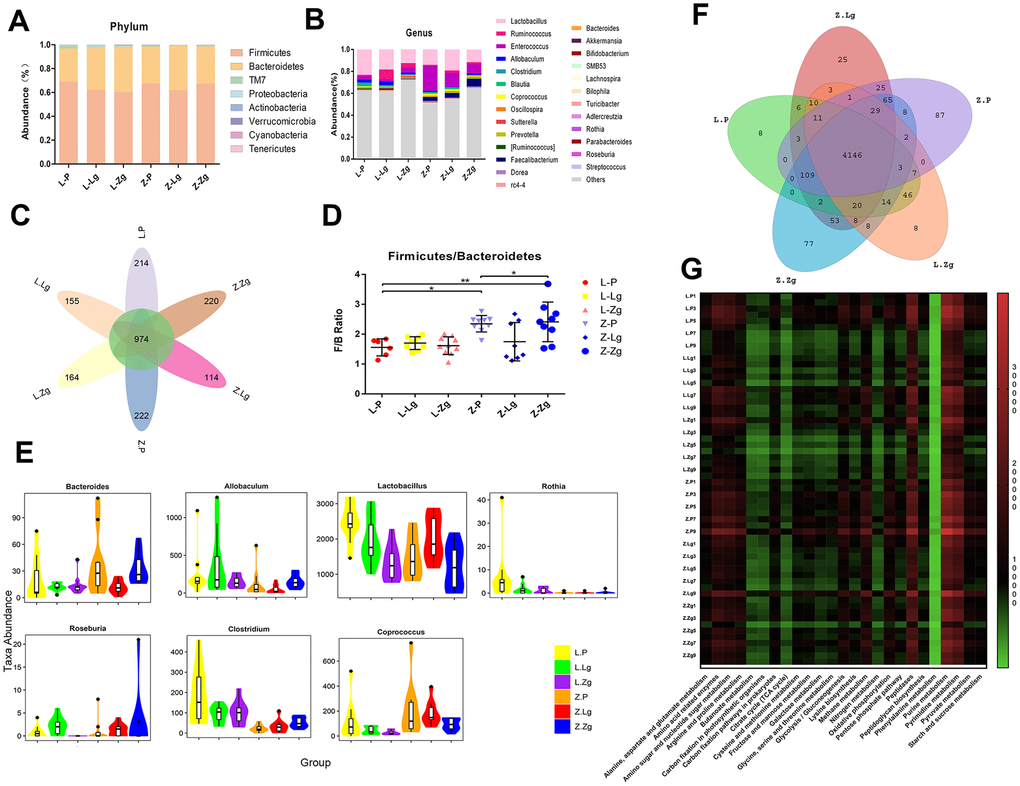
Figure 3.Specific phyla and genera in each group after FMT. (A) Relative abundance of bacteria at the phylum level (n = 10); (B) Relative abundance of bacteria at genus level (n = 10); (C) The petal diagram revealed common and unique genera associated with different groups. Different colors represented different modules; (D) Firmicutes / Bacteroidetes ratio (F5, 45 = 6.511, P = 0.0001; n = 8-9). Statistical analysis was performed with two-way ANOVA. *P < 0.05, **P < 0.01. The data were expressed as the mean ± SD; (E) Violin maps of abundance distribution of seven OTUs with the most significant difference among sample groups. The abscissa represented the group, and the ordinate represented the number of sequences of each taxon in each sample (group) (n = 10). Using Mothur software, the statistical algorithm of Metastats was invoked to test the difference in sequence quantity (absolute abundance) between the samples (groups) of each taxon at the phylum and genus levels; (F) The venn diagram of common functional groups predicted by PICRUSt. Each ellipse represented a sample (group). The overlapping regions between ellipses indicated common functional groups among the samples (groups). The number in each block indicated the number of common or unique functional groups of the samples (groups) included in the block; (G) KEGG third-level pathway heat map predicted by PICRUSt. The abscissa was the third level functional group of KEGG, and the ordinate was the sample number. The color markers were the number of macrogenomes constructed from biom files. The intensity of the colors represented the degree of association (red, higher number of corresponding samples; green, lower number of corresponding samples).