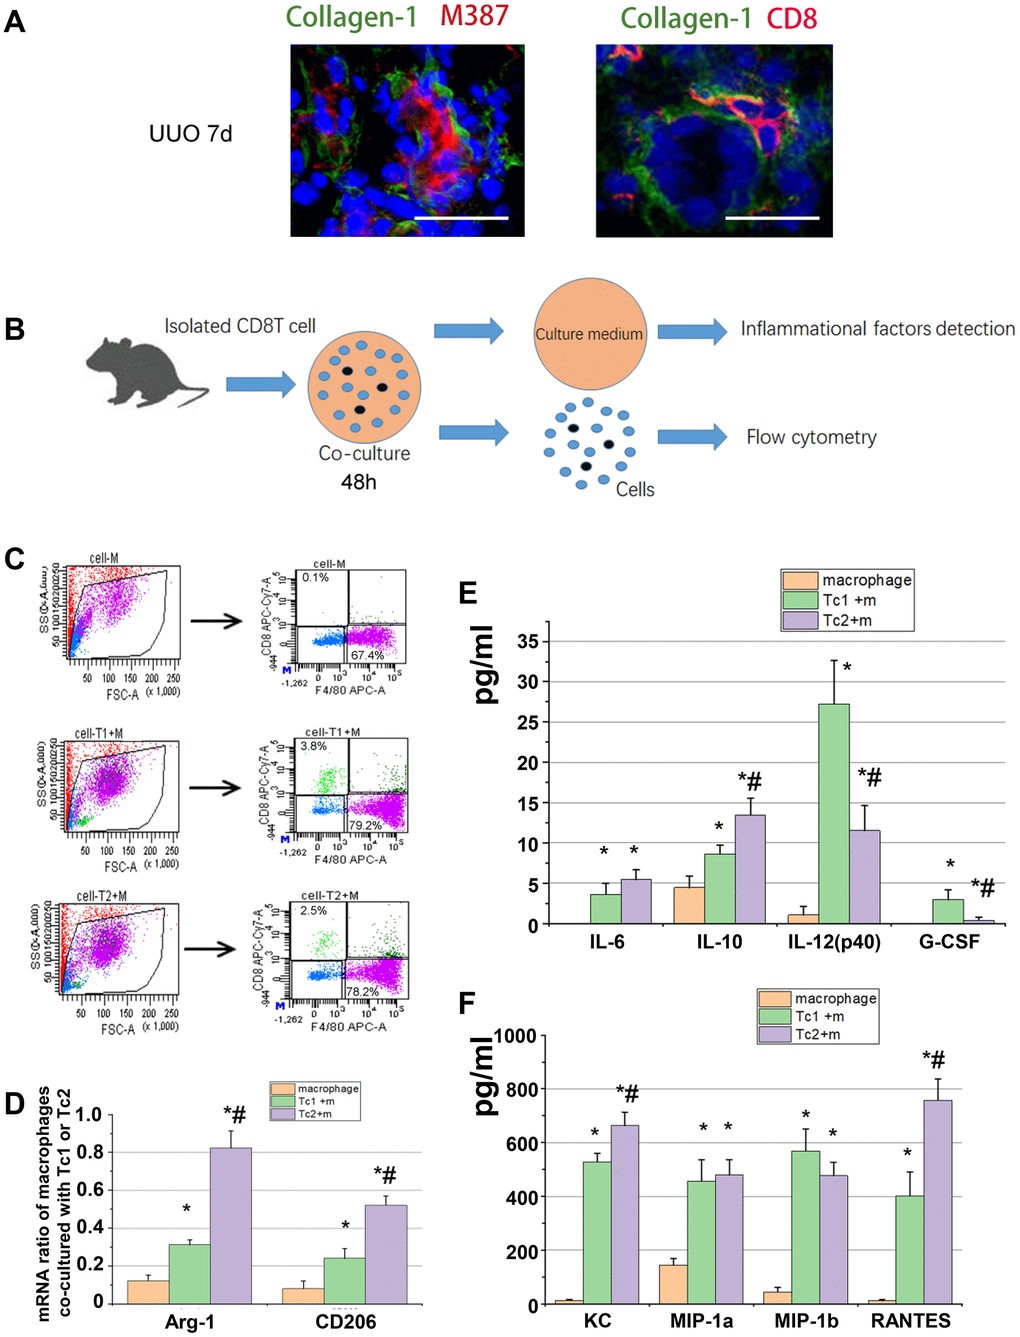
Figure 3.Tc2 showed stronger capability for inducing macrophage development to M2 than Tc1. (A) Representative photomicrographs showing kidney sections from UUO mice at day 7. The sections were stained with Collagen-1 (green) and M387 or CD8 (red), counterstained with DAPI (blue), and examined through confocal microscopy (scale bars, 20 μm). Positive signals were observed in the renal interstitium. (B) CD8+ T cells (Tc1 and Tc2) were isolated from the kidneys of UUO mice and cocultured with Raw264.7 cells for 48 h (1 × 10⁴ T cells and 1 × 10⁵ Raw264.7 cells per well). The cell culture medium was collected for inflammatory factor detection, and the cells were collected for flow cytometry. (C) Representative examples of the FACS analysis of cocultured cells. The cells were stained with CD8 and F4/80, and Raw264.7 cells were sorted through flow cytometry for mRNA examination. (D) mRNA levels of Arg-1 and CD206 in M2 were tested by using qPCR (*p < 0.05 vs. Raw264.7 cells, #p < 0.05 vs. Tc1 + Raw264.7 cells). (E, F) Inflammatory factors were evaluated by using a Luminex multiplex murine cytokine assay. Cytokines that were significantly elevated are shown (*p < 0.05 vs. Raw264.7 cells, #p < 0.05 vs. Tc1 + Raw264.7 cells).