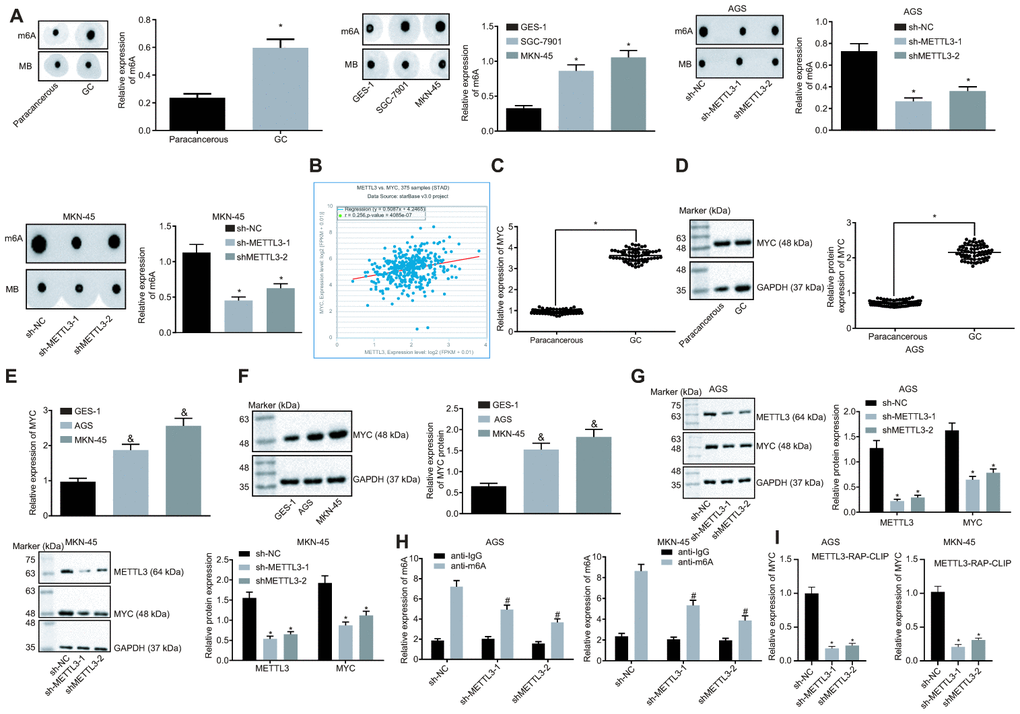
Figure 4.Silencing of METTL3 reduces MYC mRNA m6A modification and impedes the MYC expression pattern in GC cells. (A) m6A modification levels in GC tissues (n = 45) and GC cells were examined by dot blot assays, * p < 0.05 vs. the paracancerous tissues or GES-1 cells. (B) METTL3 and MYC co-expression in GC from the TCGA database. Each point represents a sample, the abscissa indicates the METTL3 expression pattern, the ordinate indicates the MYC expression pattern, and the upper left indicates the correlation coefficient and p value. (C and D), MYC mRNA expression and protein expression patterns in GC and paracancerous tissues (n = 45) were determined by RT-qPCR (C) and Western blot assay (D), normalized to GAPDH, which were expressed as mean ± standard deviation, and test with paired t-test, * p < 0.05 vs. the paracancerous tissues. (E and F) MYC mRNA expression and protein expression patterns in AGS and MKN-45 cells were determined by RT-qPCR (E) and Western blot assay (F), normalized to GAPDH. (G) Representative Western blots of MYC protein and its quantitation in AGS and MKN-45 cells after silencing METTL3, normalized to GAPDH. (H) Me-RIP and RT-qPCR were used to examine m6A levels of MYC mRNA in AGS and MKN-45 cells after silencing METTL3. (I) The binding of METTL3 to MYC mRNA assessed by PAR-CLIP assay in GC cells following METTL3 silencing. The above results were measurement data, and expressed as mean ± standard deviation. Data in panels A (the left), (C and D) were compared by paired t test, and in panels A (the middle and the right) and (E–I) by one-way ANOVA with Tukey’s post hoc test. The cell experiment was repeated 3 times independently.