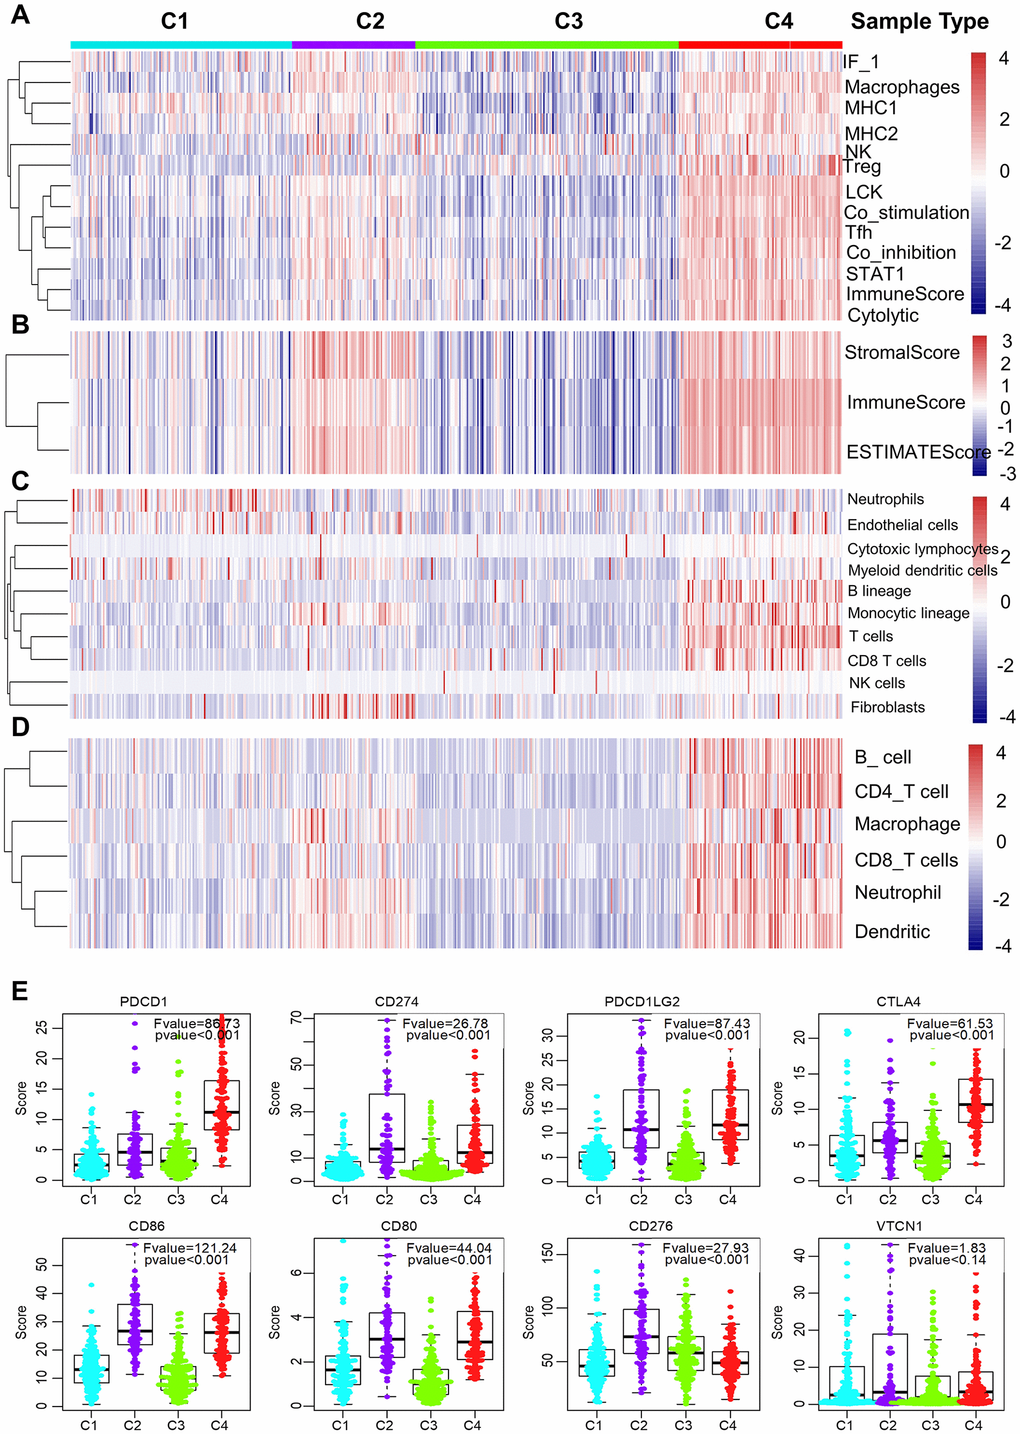
Figure 3.Immune signature of the four subtypes in the TCGA cohort. (A–D) Heatmaps showing the gene expression scores of immune profiles of the four subtypes. A two-color scale was used, with red indicating high expression and blue representing low expression. (A) The expression levels of 13 immune metagenes among the four subtypes. The 13 immune metagenes: IF1, macrophages, MHC2, MHC1, NK, T regulatory cells, lymphocyte-specific kinase (LCK), STAT1, T follicular cells, T cell inhibitory and stimulatory activity, and immune score and cytolytic activity. (B) The expression scores of genes included in the ESTIMATE algorithm for determination of stromal and immune gene signatures. (C) The expression scores of 10 groups of immune-associated cells. (D) The expression levels of genes included in the TIMER algorithm for assessment of immune infiltrates. (E) Differential expression of checkpoint molecules among the four immune subtypes. Boxplots indicate 5%, 25%, 50%, 75%, and 95%, respectively. Comparisons between subtypes were performed by Analysis of Variance (ANOVA). P-values were corrected by the Bonferroni method.