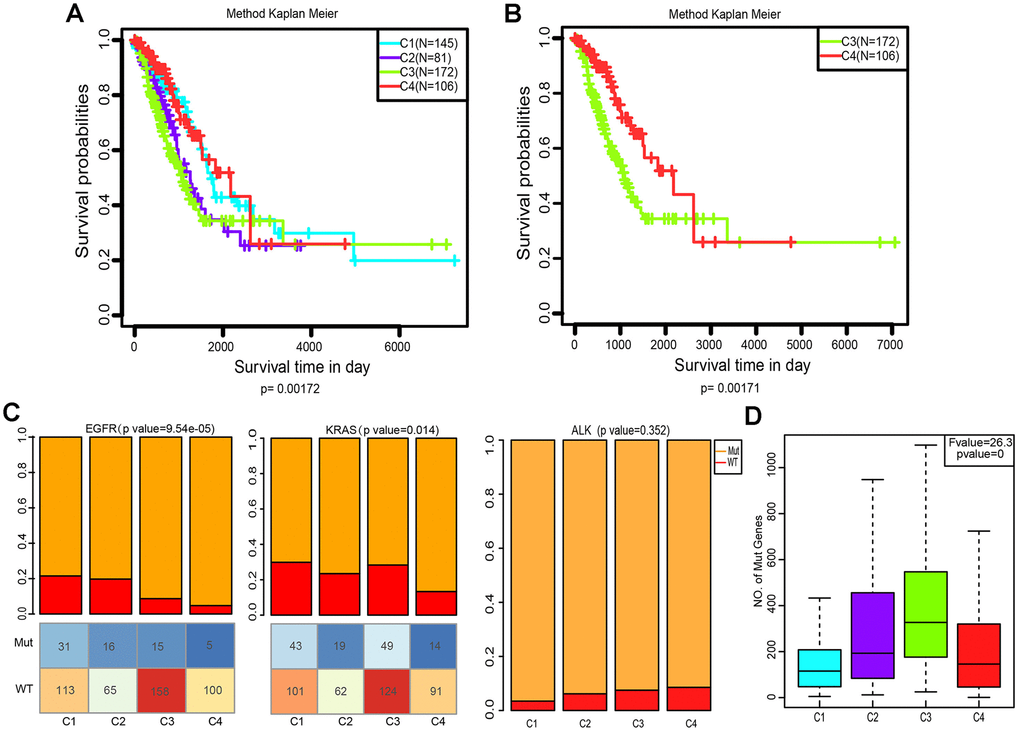
Figure 4.Kaplan–Meier curves and mutation status of the four immune subtypes. (A) Overall survival (OS) of the four subtypes (log-rank test). (B) Five-year Kaplan–Meier curves for OS of subtypes C3 and C4 (log-rank test). (C) Distribution of EGFR, KRAS and ALK mutant among the four subtypes. The lower half represents the number of EGFR/KRAS mutant and wild-type of different subtypes (chi-square test). (D) Distribution of the number of mutant genes in the four samples (Analysis of Variance, p<0. 0001).