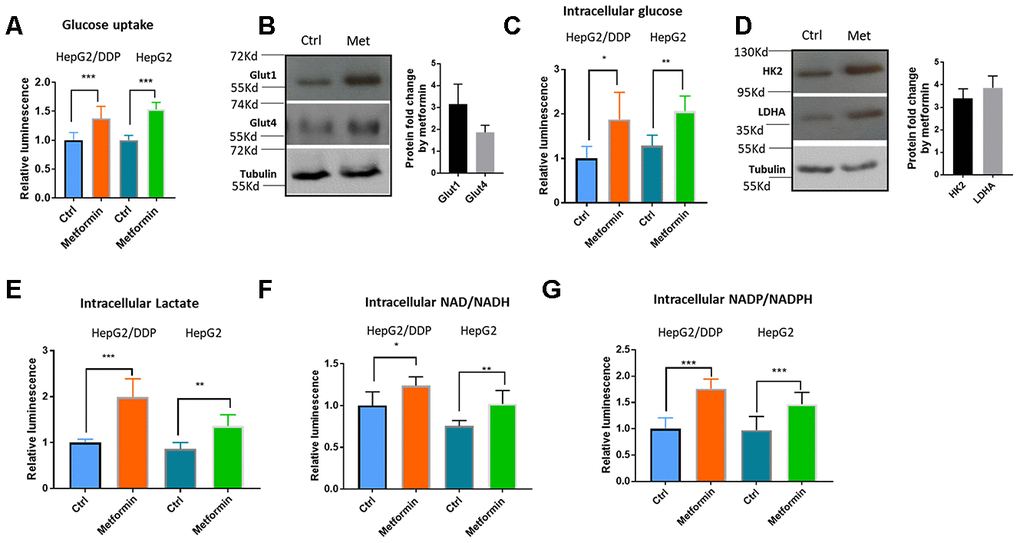
Figure 3.Metformin increased glucose uptake and glycolysis in HepG2/DDP cells. (A) Metformin increased glucose uptake. Indicated cells were treated with or without metformin (1mM) for 24 hours and glucose uptake assay were conducted with Glucose Uptake-Glo. Cell Titer-Glo was also carried out to measure the relative viability, which was used to normalize the data in glucose uptake assay. Data from 3 independent biological samples of 3 replicates were statistically analyzed by student’s t-test (*** P<0.0001). (B) Metformin increased the expression of glucose transporter Glut1 and Glut4. HepG2/DDP cells were treated with or without metformin (1mM) for 24 hours and total cell lysates were separated by SDS-PAGE. Glut1 and Glut4 protein levels were detected by Western blot using specific antibodies to Glut1 and Glut4. Tubulin was used as internal control. Representative images of were shown. Quantification of N= 2 biological repeats were shown in bar graph. (C) Metformin increased intracellular glucose concentration in HepG2/DDP cells. HepG2/DDP cells were treated with or without metformin (1mM) for 24 hours, washed extensively and intracellular glucose concentration was measured by using Glucose-Glo kit. Data from 2 independent biological samples of 3 replicates were plotted and statistically analyzed by student’s t-test (** P<0.001). (D) Metformin increased the protein levels of glycolytic enzymes HK2 and LDHA. Experiment was conducted as in (B) except HK2 and LDHA antibodies were used. Representative images of were shown. Quantification of N= 3 biological repeats were shown in bar graph. (E) Metformin increased intracellular lactate production. Indicated cells were treated with or without metformin (1mM) for 24 hours, washed extensively then intracellular lactate concentration was measured by using lactate-Glo kit. Data from 2 independent biological samples of 3 replicates were plotted and statistically analyzed by student’s t-test (** P<0.001, *** P<0.0001). (F) Metformin increased intracellular NAD/NADH production. HepG2/DDP cells were treated with or without metformin (1mM) for 24 hours and lactate concentration was measured by using NAD/NADH -Glo kit. Data from 2 independent biological samples of 3 replicates plotted and statistically analyzed by student’s t-test (* P<0.05, **P<0.001). (G) Metformin increased intracellular NADP/NADPH production. HepG2/DDP cells were treated with or without metformin (1mM) for 24 hours and lactate concentration was measured by using NADP/NADPH -Glo kit. Data from 2 independent biological samples of 3 replicates were plotted and statistically analyzed by student’s t-test (*** P<0.0001).